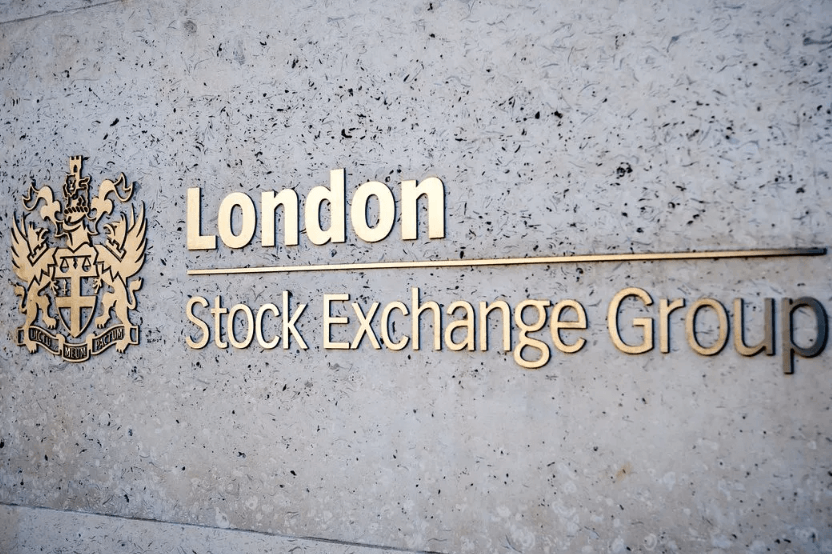
The Financial Times Stock Exchange 100 Index, also known as the FTSE 100 Index, is a stock index comprising the 100 companies with the highest market capitalization listed on the London Stock Exchange. It serves as a key indicator of the prosperity of businesses governed by British company law. Managed by the FTSE Group, a subsidiary of the London Stock Exchange Group, the FTSE 100 Index is widely regarded as a barometer of the UK economy.
Historical trends

Since its inception in 1984, the FTSE 100 Index has experienced significant fluctuations, reflecting both the broader economic climate and specific events affecting the listed companies. Major economic events, such as the dot-com bubble, the 2008 financial crisis, and Brexit, have all left their marks on the index. Historically, the FTSE 100 has shown resilience, often recovering from downturns to reach new highs. For instance, despite the sharp declines during the 2008 financial crisis, the index gradually rebounded, demonstrating the robustness of the UK's largest companies.
Related Index and Comparison
The FTSE 100 Index is composed of the 100 largest UK companies by market value, calculated by multiplying a company's stock price by the total number of its issued shares. Many of these companies, however, have substantial international operations, making the FTSE 100 somewhat less reflective of the domestic UK economy. The performance of these companies can be significantly influenced by global market conditions and exchange rate fluctuations, particularly the pound sterling.
For a better gauge of the UK economy, the FTSE 250 Index is often considered more representative. It includes the next 250 largest companies outside of the FTSE 100, with a higher proportion of businesses focused on the domestic market. This makes the FTSE 250 a more accurate barometer of the economic health within the UK.
Comprehensive Market Indicators
While the FTSE 100 is the most well-known UK stock market index, there are several other indices that provide a more comprehensive view of the market:
FTSE 250 Index: Tracks the next 250 largest companies after those in the FTSE 100, offering insight into mid-cap companies with a significant domestic focus.
FTSE 350 Index: A combination of the FTSE 100 and FTSE 250, this index represents the 350 largest companies listed on the London Stock Exchange.
FTSE Small Cap Index: Includes companies smaller than those in the FTSE 350, capturing the performance of the smaller segment of the market.
FTSE All-Share Index: Encompasses the FTSE 100, FTSE 250, and FTSE Small Cap indices, providing a comprehensive overview of the entire UK equity market.
FTSE Emerging Index: Focuses on companies from emerging markets, reflecting the performance of smaller, potentially high-growth firms.
Insights into the UK Economy
The FTSE 100 is an important economic indicator but should be considered alongside other indices for a complete picture of the UK's economic landscape. The FTSE 250, which focuses more on domestic companies, and the FTSE All-Share Index, with its broad market coverage, are especially useful for investors and analysts seeking a comprehensive understanding of market dynamics. The FTSE 100 Index remains a crucial tool for monitoring the performance of the UK's largest companies. However, to gain a nuanced understanding of the UK economy, it's essential to also look at indices like the FTSE 250 and the FTSE All-Share Index. Together, these indices provide a detailed view of the market, helping investors navigate the complexities of the financial landscape.
By understanding these indices, investors and analysts can gauge market sentiment, assess economic conditions, and make informed investment decisions. Tracking the performance of these indices offers valuable insights into both the strengths and weaknesses of the UK economy.