Published on: 2025-05-23
Updated on: 2025-05-23
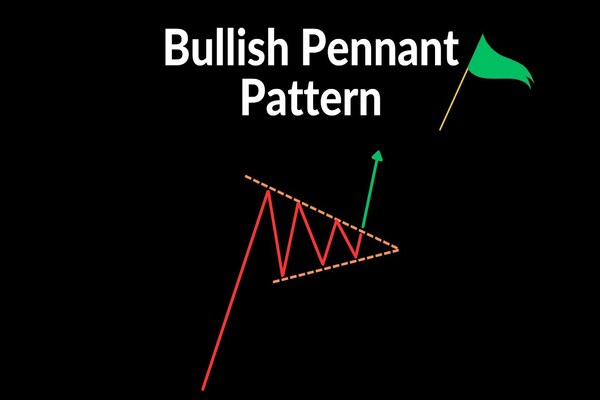
A bullish pennant is one of the most reliable continuation patterns in technical analysis, often signalling that a strong upward trend is ready to resume after a brief pause.
Recognising this pattern can help traders spot high-probability breakout opportunities and manage their trades with greater confidence. This article explains what a bullish pennant is, how to identify it, and why it's considered a sign of market strength.

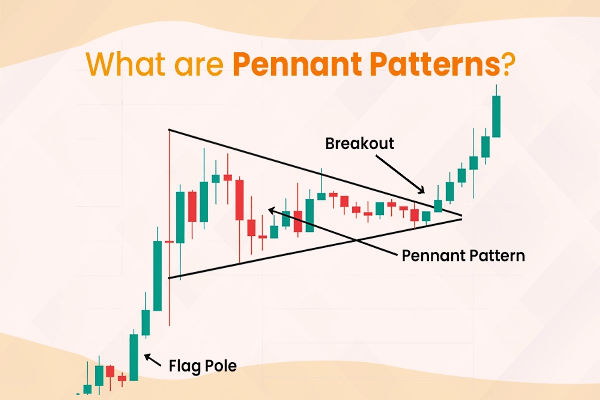
A bullish pennant forms during a strong uptrend, typically after a sharp price rally known as the “flagpole.” Following this surge, the market consolidates in a small, symmetrical triangle or pennant shape, marked by converging trendlines. This pause reflects a temporary balance between buyers and sellers before the trend resumes.
Key characteristics of a bullish pennant:
Flagpole: A steep, rapid price increase leading into the pattern.
Pennant: A short consolidation period with lower highs and higher lows, forming a triangle.
Breakout: A decisive move above the upper trendline, signalling the continuation of the uptrend.
How to Identify a Bullish Pennant
Spotting a bullish pennant on a price chart involves three main steps:
Look for a strong upward move: The pattern must be preceded by a sharp rally with high volume, forming the flagpole.
Identify the consolidation: Price action should contract into a small triangle, with volume typically declining as the pattern develops.
Watch for the breakout: A bullish pennant is confirmed when price breaks above the upper trendline, ideally with a surge in volume.
The bullish Pennant Pattern reflects a market that remains in control of the buyers. The initial rally demonstrates strong demand, while the consolidation shows that sellers are unable to reverse the trend—merely slowing it down.
When the breakout occurs, it signals that buyers have regained momentum and are likely to push prices even higher.
Key reasons it signals strength:
Momentum remains with the bulls: The pause is brief and shallow, indicating little selling pressure.
Volume confirms conviction: Breakouts from bullish pennants are often accompanied by increased trading volume, showing renewed enthusiasm from buyers.
Clear continuation signal: The pattern's structure provides a logical entry point and target for traders following the trend.

1. Entry Points
Most traders enter a long position when the price breaks above the pennant's upper trendline, confirming the continuation of the uptrend. Waiting for a close above this level or a surge in volume can reduce the risk of false breakouts.
2. Setting Targets
A common method for setting a price target is to measure the height of the flagpole and project it upward from the breakout point. This gives an estimated move that often aligns with the next resistance level.
3. Managing Risk
Place a stop-loss just below the pennant's lower trendline or the recent swing low. This protects your capital if the breakout fails and the price reverses.
Mistakes to Avoid
Entering too early: Jumping in before a confirmed breakout can expose you to whipsaws.
Ignoring volume: Weak volume on the breakout may indicate a lack of conviction.
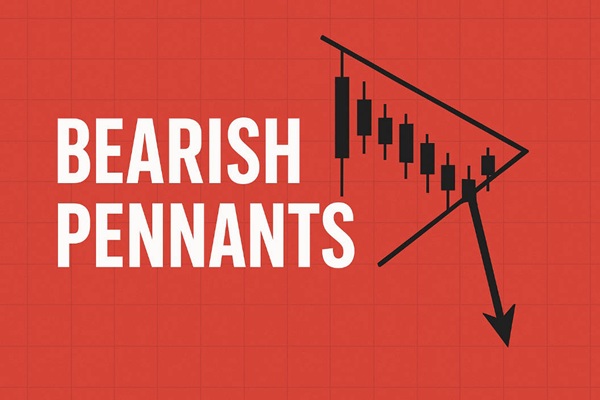
Confusing with other patterns: Make sure the pattern is a true pennant, not a flag or wedge, by checking for converging trendlines and a clear flagpole.
Real-World Example
Imagine a stock surges from £100 to £120 in a matter of days, then consolidates between £118 and £122, forming a small triangle. After several sessions, the price breaks above £122 with a spike in volume. This classic bullish pennant signals that the uptrend is likely to continue, offering traders a clear entry and target.
Understanding and trading bullish pennants can give you an edge in trending markets. By patiently waiting for the right setup and confirming the breakout with volume, you can capitalise on strong continuation moves while managing your risk effectively.
Keep this pattern in your technical analysis toolkit to spot opportunities and trade with greater confidence.
Disclaimer: This material is for general information purposes only and is not intended as (and should not be considered to be) financial, investment or other advice on which reliance should be placed. No opinion given in the material constitutes a recommendation by EBC or the author that any particular investment, security, transaction or investment strategy is suitable for any specific person.