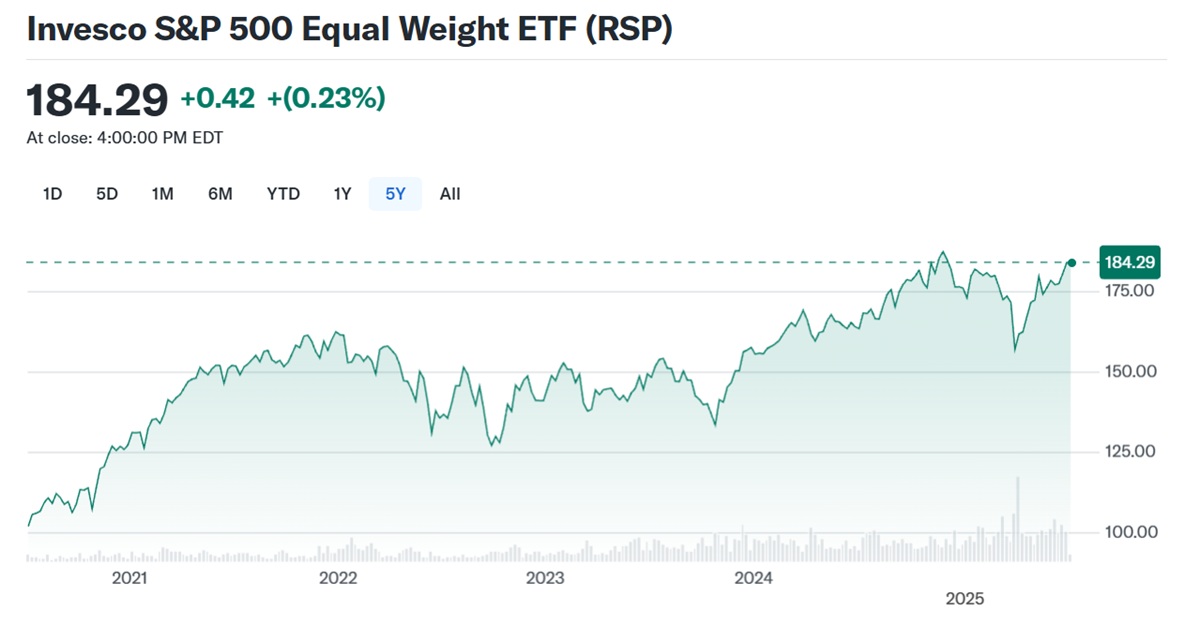
As investors increasingly seek diversification, lower concentration risk, and balanced exposure to US equities, the Invesco S&P 500 Equal Weight ETF (RSP) has gained prominence. Unlike traditional market-cap-weighted indices that are dominated by mega-cap technology stocks, RSP provides an alternative approach—one that equally weights every company in the S&P 500. regardless of size. But what exactly does that mean, and why does it matter for portfolio construction?
What Is an Equal-Weight ETF?

An equal-weight ETF gives every constituent company the same portfolio weight, regardless of its market capitalisation. In the case of RSP, each of the 500 S&P 500 companies represents approximately 0.2% of the ETF at the time of each quarterly rebalancing.
This approach contrasts sharply with traditional market-cap-weighted ETFs like SPY or IVV, where large-cap stocks—especially tech giants like Apple, Microsoft, and NVIDIA—carry outsized influence on performance.
Key differences:
Diversification: Equal weighting reduces dependency on the largest companies.
Rebalancing Discipline: RSP sells relative winners and buys relative laggards every quarter.
Higher Volatility: RSP tends to exhibit more volatility than cap-weighted peers due to higher exposure to mid-cap and cyclical stocks.
Long-Term Edge: Over long horizons, equal-weighting has historically outperformed during periods when smaller and value-oriented stocks led the market.
RSP at a Glance
 Launched in April 2003 by Invesco, RSP is one of the earliest and most established equal-weight ETFs available on the market.
RSP at a Glance
| Attribute |
Details |
| Fund Name |
Invesco S&P 500 Equal Weight ETF |
| Ticker Symbol |
RSP |
| Assets Under Management |
~$42 billion (as of mid-2025) |
| Number of Holdings |
500 (equal to the S&P 500 index) |
| Expense Ratio |
0.20% |
| Rebalancing Frequency |
Quarterly |
| Dividend Yield |
~1.56% (trailing 12 months) |
RSP offers broad U.S. equity exposure without allowing any single company to dominate. This structure is particularly attractive for investors seeking to dilute the influence of Big Tech or prepare for shifts in sector leadership.
Core Advantages of RSP
RSP provides a number of compelling advantages that set it apart from its market-cap-weighted counterparts:
Reduced Concentration Risk
Traditional S&P 500 ETFs are heavily concentrated in the top 10 mega-cap names, which often account for 25–30% of total index weight. In contrast, RSP spreads risk equally across all constituents, helping to protect portfolios from drawdowns when large-cap tech underperforms.
Greater Exposure to Mid-Cap and Value Stocks
Because of the equal-weight approach, RSP tends to have higher exposure to value-oriented sectors such as financials, industrials, and consumer discretionary. This makes it particularly relevant in environments favouring cyclical recovery or rising interest rates.
Contrarian Rebalancing Effect
RSP's quarterly rebalancing strategy systematically trims outperformers and reallocates to underperformers—buying low and selling high in effect. This can provide a performance edge over time, especially in mean-reverting markets.
Diversification Across Sectors
Equal weighting naturally avoids sector over-concentration. For example, while the market-cap S&P 500 has over 25% exposure to Information Technology, RSP typically allocates around 10–12% per sector, resulting in a more balanced portfolio.
Long-Term Outperformance Potential
Historical data suggests that RSP has outperformed SPY during extended periods of broad-based equity rallies or when value stocks lead. However, it may underperform in narrow bull markets dominated by a few mega-cap names.
Key Metrics & Performance
As of July 2025. here are the key performance and structural metrics for RSP:
Key Metrics & Performance of RSP ETF
| Metric |
Value |
| YTD Return |
~8.2% |
| 1-Year Return |
~12.5% |
| 5-Year Annualised |
~10.3% |
| Volatility (3Y) |
Slightly higher than SPY (~15% vs 13%) |
| Beta (vs SPY) |
~0.85–0.90 |
| Dividend Yield |
~1.56% |
Top Current Holdings (equal-weighted):
Since RSP is rebalanced quarterly, every company has approximately 0.20% weight, regardless of its size. While the names vary, the largest contributors to performance may include companies like:
Nucor Corporation
Molina Healthcare
DXC Technology
APA Corp
Campbell Soup Company
This rotation leads to a dynamic top-ten list, reflecting recent market performance and not market cap dominance.
Who Should Consider RSP?
RSP is not suitable for every investor, but it can play a valuable role in certain portfolios. Here's who may benefit most:
Investors concerned about the increasing concentration risk in mega-cap tech names (especially in SPY or QQQ) can use RSP to diversify across all 500 companies equally.
RSP's higher allocation to financials, energy, and industrials makes it attractive for those seeking exposure to value and cyclical sectors during economic recovery phases.
Those with a 10+ year investment horizon who are comfortable with modestly higher volatility may benefit from RSP's potential long-term alpha over cap-weighted alternatives.
RSP can be used alongside SPY or IVV to offset concentration risk. For example, a 70/30 blend of SPY and RSP can provide the growth engine of large-caps while integrating equal-weight discipline.
In environments where small- and mid-cap stocks show momentum, or where breadth is strong across all sectors, RSP can be tactically overweighted for additional upside.
Final Thoughts
The Invesco S&P 500 Equal Weight ETF (RSP) offers a smart and simple way to diversify equity exposure and hedge against the pitfalls of market-cap concentration. By giving every company in the S&P 500 the same weight, RSP encourages discipline, diversification, and potential outperformance during broad market rallies or rotational environments.
While RSP does come with slightly higher costs (0.20% expense ratio) and volatility than its market-cap peers, it presents a compelling case for investors who believe in mean reversion, value rotation, or simply wish to reduce reliance on mega-cap tech dominance.
As always, RSP should be considered in the context of one's broader investment goals, time horizon, and risk tolerance. But for many investors, adding a slice of equal-weighted exposure may be a step toward a more resilient and balanced portfolio.
Disclaimer: This material is for general information purposes only and is not intended as (and should not be considered to be) financial, investment or other advice on which reliance should be placed. No opinion given in the material constitutes a recommendation by EBC or the author that any particular investment, security, transaction or investment strategy is suitable for any specific person.


 Launched in April 2003 by Invesco, RSP is one of the earliest and most established equal-weight ETFs available on the market.


