Published on: 2023-10-31
Updated on: 2026-05-11
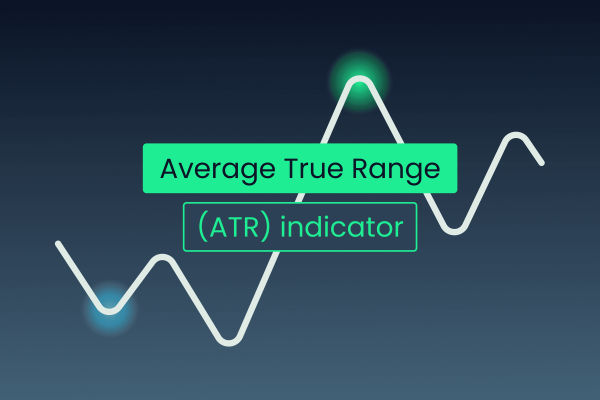
The average true range is one of the simplest ways to answer a question every trader faces: how much is this market actually moving? Price direction matters, but volatility decides whether a stop loss is too tight, whether a breakout has enough force, and whether a position size is realistic.
That makes ATR especially useful in today’s market. In 2025, tariff headlines contributed to heavy FX volatility and record daily FX turnover of $9.51 trillion during the BIS survey period. By 2026, volatility had eased in some currency pairs, but hedging demand remained strong. ATR helps traders adapt when volatility expands, contracts, or rotates between forex, gold, indices, and commodities. ")
Average true range measures volatility, not direction. A rising ATR means price ranges are expanding, but it does not tell traders whether to buy or sell.
ATR helps set stop losses with market noise in mind. A 2x ATR stop gives a trade more room than a fixed 20-pip stop during active conditions.
ATR can improve position sizing. When ATR rises, traders often reduce lot size to keep account risk stable.
ATR works across forex, gold, stocks, indices, and futures. The value changes by instrument, so traders should compare ATR relative to price and timeframe.
ATR is most useful with structure. It works better when combined with support, resistance, trend lines, moving averages, RSI, or price action.
The Average True Range, or ATR, is a technical indicator developed by J. Welles Wilder in 1978. It was originally designed for commodities but is now widely used for forex, equities, indices, gold, oil, and futures.
ATR measures the average size of price movement over a selected period. The most common setting is 14 periods, which can mean 14 daily candles, 14 hourly candles, or 14 five-minute candles, depending on the chart.
A higher ATR indicates the market is moving through wider price ranges. A lower ATR means the market is quieter. For example, if EUR/USD has a daily ATR of 70 pips, it has recently moved around 70 pips per day on average. If the ATR falls to 35 pips, the market has become much quieter.
The key point is that ATR does not measure trend direction. A market can fall sharply and show a rising ATR. It can also rally strongly and show a rising ATR. ATR only tells traders how large the recent price range has been.
This matters in 2026 because market volatility is no longer confined to one asset class. The IMF’s April 2026 outlook highlighted renewed disruption from the Middle East conflict, rising commodity prices, firmer inflation expectations, and tighter financial conditions. ATR gives traders a chart-based way to measure how those macro shocks translate into a tradable range.
ATR begins with the True Range, or TR. True Range looks at the largest price movement from three calculations:
Current high minus current low
Current high minus previous close
Previous close minus current low
The largest of these three values becomes the True Range for that period.
This matters because markets can gap. A simple high-low range may miss part of the move if the price opens far above or below the previous close. True Range includes that gap, giving a more complete view of volatility.
The ATR formula is:
ATR = Average of True Range over n periods
Most platforms use 14 periods as the default. Some use Wilder’s smoothing method, while others show a simple moving average version. The difference is usually small for general trading decisions, but traders should keep the settings consistent when testing a strategy.
A short ATR setting, such as 7 periods, reacts faster but creates more noise. A longer setting, such as 20 or 50 periods, reacts more slowly but gives a smoother volatility reading.
ATR should always be read in context. A 100-point ATR on an index is different from a 100-pip ATR on a currency pair. A $60 ATR on gold means something different when gold trades near $2,000 than when it trades near $4,500.
The best approach is to compare ATR with recent history. If the current ATR is near a three-month high, the market is in a phase of volatility expansion. If ATR is near a three-month low, the market may be compressing before a breakout.
ATR can also help traders avoid poor stop placement. A 15-pip stop on EUR/USD may be reasonable during quiet Asian-session trading, but it may be too tight during US CPI, Non-Farm Payrolls, or a central-bank decision. If the ATR shows that the pair is moving 80 pips per day, a 15-pip stop may sit inside normal market noise.
ATR is most useful for placing stop losses. Instead of choosing a random number of pips, traders can base the stop on current volatility.
A common method is:
Stop loss distance = ATR x multiplier.
For example, if GBP/USD has a 1-hour ATR of 20 pips, a trader may use a 2x ATR stop, or 40 pips. If volatility rises and ATR expands to 35 pips, the same 2x method gives a 70-pip stop.
This does not mean wider stops are always better. It means the stop should match the market environment. A stop that is too tight may get hit by normal noise. A stop that is too wide may create poor risk-reward.
ATR can also help control risk. When volatility rises, the distance to a logical stop often becomes wider. If the trader keeps the same lot size, account risk increases.
For example:
This is one of ATR’s biggest strengths. It links volatility to capital protection. Traders who adjust position size with ATR are less likely to over-leverage during fast markets.
A breakout is stronger when it comes with range expansion. If price breaks resistance while ATR is rising, the move may show real participation. If price breaks resistance while ATR is flat or falling, the move may lack force.
This is especially useful in gold, indices, and major FX pairs. For example, if USD/JPY breaks above resistance while its daily ATR expands, traders can read that as a volatility-backed breakout. If the pair breaks the level but ATR remains compressed, the move may be more vulnerable to reversal.
USD/JPY remained an important volatility example in May 2026, trading near 156.63 on 8 May, with the yen still weaker over the prior 12 months despite short-term strength. Wider macro ranges make volatility-adjusted stops more useful than fixed-pip assumptions.
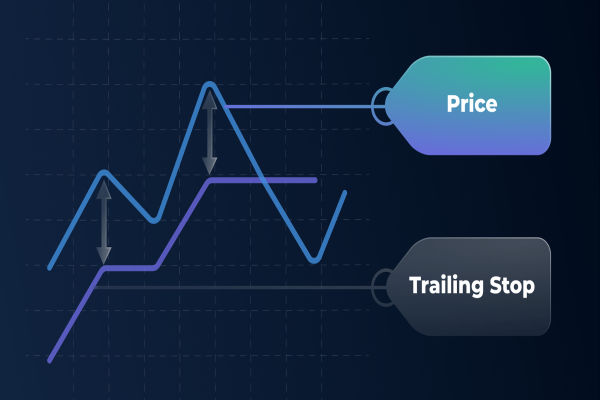
ATR is also useful for protecting profits. A trailing stop based on ATR moves with the market while allowing room for normal pullbacks.
For example, a trend trader may trail a long position with a stop set 2x ATR below the latest swing high. If ATR rises, the stop gives the trade more room. If ATR falls, the stop tightens as volatility contracts.
This approach works best in trending markets. In choppy ranges, ATR trailing stops may trigger too often.
The first mistake is treating ATR as a buy-or-sell signal. ATR does not show direction. It must be combined with trend structure, support and resistance, or momentum tools.
The second mistake is using the same ATR setting for every strategy. A scalper, swing trader, and position trader need different timeframes. A 14-period ATR on a five-minute chart is not the same as a 14-period ATR on a daily chart.
The third mistake is ignoring spreads and slippage. ATR measures price range, not trading cost. During major news, spreads can widen and execution can worsen. A stop that looks reasonable on the chart may still be vulnerable if liquidity is thin.
The fourth mistake is assuming low ATR means low risk. Low volatility can produce false confidence. Many large breakouts begin after ATR compression because the market has been building energy in a narrow range.
The standard ATR setting is 14 periods. It works well as a starting point for most traders. Shorter settings react faster but create more noise. Longer settings are smoother but slower to reflect sudden volatility changes.
No. ATR measures volatility only. A rising ATR indicates the market is moving through larger price ranges, but it does not indicate whether the price will rise or fall. Direction should come from trend, structure, support, resistance, or momentum analysis.
Yes. ATR is especially useful in forex because currency-pair volatility varies across sessions, economic releases, and central bank events. Traders can use ATR to adjust stop-loss distance, position size, and breakout expectations.
Yes. ATR works well with RSI, moving averages, and support and resistance analysis. For example, moving averages can define trend direction, RSI can show momentum, and ATR can help decide whether the stop distance is realistic.
A high ATR is neither good nor bad. It simply means volatility is elevated. High ATR can create opportunity, but it also increases risk. Traders should usually reduce position size or demand stronger confirmation when ATR is unusually high.
The Average True Range is not a forecasting tool. It is a volatility tool, and that is why traders use it. ATR helps convert market movement into practical decisions: where to place a stop, how large a position to take, whether a breakout has force, and whether current conditions warrant greater caution.
Its value is strongest when markets shift quickly. In calm conditions, ATR prevents traders from overestimating opportunity. In volatile conditions, it prevents them from treating normal price noise as a trend failure. Used with structure, discipline, and sensible risk sizing, ATR remains one of the clearest tools for reading market movement.
Disclaimer: This material is for general information purposes only and is not intended as (and should not be considered to be) financial, investment or other advice on which reliance should be placed. No opinion given in the material constitutes a recommendation by EBC or the author that any particular investment, security, transaction or investment strategy is suitable for any specific person.