Timing is everything in trading, and many investors are constantly seeking an edge to understand market momentum. Enter the McClellan Oscillator, a market breadth tool that has stood the test of time.
While it may not be as widely recognised as the MACD or RSI, this lesser-known indicator offers powerful insights into the strength or weakness of a market move.
If you're looking for more reliable signals and a deeper understanding of market internals, learning how to use the McClellan Oscillator could be a game-changer.
What Is the McClellan Oscillator?
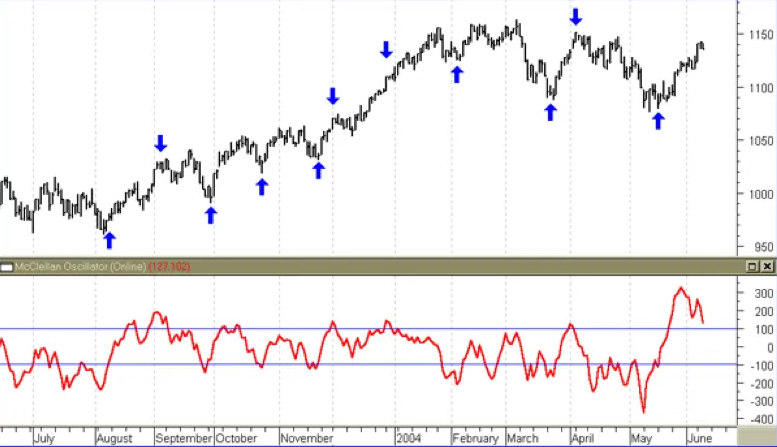
The McClellan Oscillator is a technical analysis tool developed by Sherman and Marian McClellan. It's based on the difference between a 19-day and 39-day exponential moving average (EMA) of the daily net advances (advancing issues minus declining issues) on a stock exchange, typically the NYSE.
Rather than focusing on price action alone, the McClellan Oscillator examines the breadth of the market. By comparing the number of stocks moving higher to those moving lower, it offers a broader sense of the market's internal strength.
Why Market Breadth Matters
Many traders rely solely on price movement, but price can sometimes give false impressions. The McClellan Oscillator adds another layer of analysis by evaluating how widespread a move really is.
For example, a rally in a few big-cap stocks might lift an index, even if most other stocks are falling. The McClellan Oscillator can help reveal such imbalances, making it a useful tool for spotting divergences between price action and market breadth.
How the McClellan Oscillator Is Calculated
The formula might sound complex, but at its core, the McClellan Oscillator uses EMA to smooth the net advances:
Net Advances = Advancing Issues – Declining Issues
Oscillator = 19-day EMA of Net Advances – 39-day EMA of Net Advances
The result is a line that oscillates above and below zero. Positive values suggest bullish momentum, while negative values point to bearish sentiment.
Interpreting the McClellan Oscillator
Understanding how to read the is key to making it work for your trading strategy. Here are a few core principles:
Crossing Zero: A move above zero can signal that momentum is shifting upward, while a drop below zero may point to increasing bearish pressure.
Overbought and Oversold Zones: Extended moves above or below certain levels can suggest that the market is overbought or oversold, respectively.
Divergences: If the oscillator moves in the opposite direction of the index, it may signal a reversal.
These signals are particularly valuable when used in conjunction with other indicators or Chart Patterns.
Using the McClellan Oscillator in Your Trading Strategy
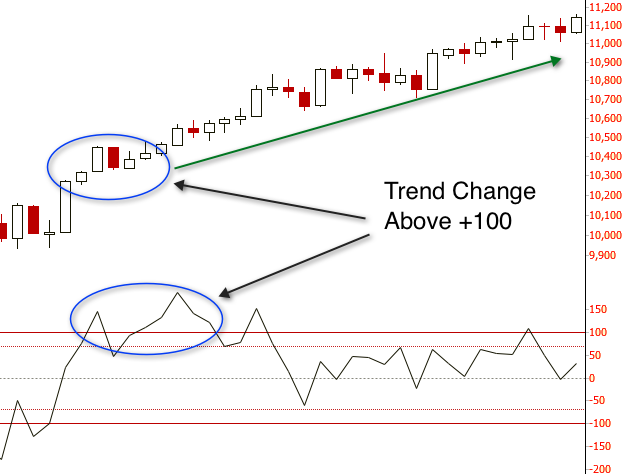
Incorporating the McClellan Oscillator into your trading doesn't mean replacing your entire system. It works best as a confirmation tool. For instance, if your price-based indicators are flashing a bullish signal, and the McClellan Oscillator is also moving above zero, it could reinforce your conviction to go long.
On the flip side, if you see a bullish pattern on the chart but the oscillator is sharply negative, it might be a warning that the rally lacks broader support.
Pros and Cons of the McClellan Oscillator
Like any indicator, the McClellan Oscillator has its strengths and weaknesses:
Pros:
Offers insight into market breadth
Helps identify divergences early
Complements price-based strategies
Cons:
May give false signals in choppy markets
Requires accurate advance-decline data
Less effective in individual stock analysis
That said, for traders who watch broader indices like the S&P 500 or Nasdaq, the oscillator can add meaningful context to otherwise confusing moves.
Conclusion
If you're a short-term trader or swing trader who relies on sentiment and market momentum, the McClellan Oscillator could be a worthy addition to your toolbox. It doesn't replace trend-following or price action strategies, but it enhances them by showing whether market participants are broadly supportive of a move.
For position traders and investors, it also provides early warnings of trend exhaustion or internal weakness, helping avoid potential traps.
Disclaimer: This material is for general information purposes only and is not intended as (and should not be considered to be) financial, investment or other advice on which reliance should be placed. No opinion given in the material constitutes a recommendation by EBC or the author that any particular investment, security, transaction or investment strategy is suitable for any specific person.


