Published on: 2025-05-14
In technical analysis, candlestick patterns are essential tools for traders looking to anticipate price movements. Two such patterns that are often mistaken for each other are the hanging man candlestick and the shooting star. Although they may appear visually similar, they signal different market sentiments and occur under different conditions.
Knowing how to tell them apart is key to avoiding false signals and strengthening your trading strategies.

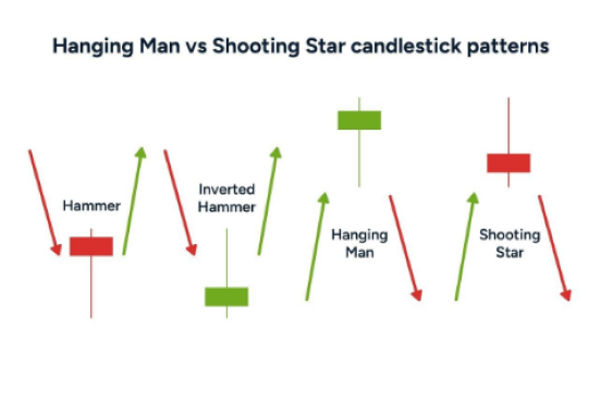
The hanging man candlestick is a bearish reversal signal that shows up near the top of an uptrend. It suggests that while buyers may still be present, sellers are starting to exert more influence on the market.
A typical hanging man candlestick has a small body located near the top of the price range, with little to no upper shadow and a long lower shadow. This lower shadow shows that prices were pushed significantly lower during the session, but buyers managed to bring them back up before closing.
However, the fact that prices dropped so far during the session indicates weakness. Traders interpret this as a possible turning point, especially if confirmed by a bearish candle in the following session.
The shooting star is another bearish reversal pattern, but its formation is different. It also appears after an uptrend, but instead of a long lower shadow, it has a long upper shadow and a small body near the bottom of the price range.
This formation suggests that buyers tried to drive prices higher but were overwhelmed by sellers who forced prices down before the close. The inability of the price to hold the higher levels implies that bullish strength may be waning.
So, while both the hanging man candlestick and the shooting star warn of potential reversals, they signal this through different market behaviours.
The main way to distinguish between the hanging man candlestick and other similar-looking patterns lies in context.
The hanging man candlestick appears after an upward move in price, usually near a resistance level. It should not be confused with the hammer, which has the same shape but appears at the bottom of a downtrend and signals a bullish reversal.
The shooting star also follows an uptrend but features a different candle structure. Unlike the hanging man candlestick, its long upper shadow represents a failed attempt by buyers to continue the rally, indicating exhaustion and a possible bearish turn.
Recognising where a candle appears within the broader trend is critical. Without that context, you might misread the signal entirely.
To understand how to use these patterns effectively, it helps to look at the psychology behind them.
The hanging man candlestick shows that sellers entered the market with force during the session, but buyers managed to recover some ground. Still, the strong sell-off mid-session implies vulnerability in the uptrend. Traders view this as a red flag and often wait for confirmation in the next candle.
In contrast, the shooting star reflects enthusiasm from buyers at the start of the session, pushing prices higher, only to be met with strong selling that brings the price back near the open. This shows that sellers are taking control, and traders take this as a potential warning of a market top.
Both patterns are bearish signals, but their stories unfold differently.

Trading based on a hanging man candlestick requires patience and confirmation. Most traders look for the next candle to close below the body of the hanging man to confirm a bearish reversal. Without this confirmation, the pattern could be a false alarm.
Some traders use volume as an extra layer of analysis. If the hanging man candlestick forms on high volume, it adds weight to the bearish interpretation. Volume indicates how serious market participants are about the price movement, and higher volume shows greater conviction.
A common approach is to place a stop loss just above the high of the hanging man and target the nearest support level. This risk management technique helps protect against failed reversals, which are common in volatile markets.
However, it is important to avoid making decisions based on a single candlestick. Always consider the broader technical picture, including moving averages, RSI or MACD, to support your position.
While the hanging man candlestick is a recognised bearish signal, it does not always lead to a reversal. In strong bullish trends, these patterns can be followed by more upward movement. This is why confirmation and context are so important.
For a hanging man candlestick to be valid, the lower shadow should be at least twice the length of the real body. If the shadow is too short, it might not qualify as a true hanging man, and traders should be cautious.
Additionally, avoid confusing the hanging man candlestick with the hammer. Though visually similar, the hammer forms at the end of a downtrend and signals a potential rise, making its implications the opposite of the hanging man.
The hanging man candlestick and the shooting star may appear similar, but their positioning, structure and psychological implications are very different. Misinterpreting these patterns can lead to poor trades and missed opportunities.
Understanding the context in which the hanging man candlestick appears, and waiting for confirmation before acting, can significantly increase the reliability of your analysis. By pairing candlestick recognition with other technical tools and sound risk management, traders can better navigate market reversals and protect their capital.
Whether you are a seasoned chartist or a beginner learning the ropes, mastering patterns like the hanging man candlestick will give you an edge in anticipating market movements and making informed trading decisions.
Disclaimer: This material is for general information purposes only and is not intended as (and should not be considered to be) financial, investment or other advice on which reliance should be placed. No opinion given in the material constitutes a recommendation by EBC or the author that any particular investment, security, transaction or investment strategy is suitable for any specific person.


World's Best Broker