Published on: 2025-05-08
For decades, traders have debated the validity of Elliott Wave Theory. Some hail it as the key to deciphering market psychology, while others brush it off as an overcomplicated, subjective system.
Whether you are a seasoned trader or just stepping into technical analysis, understanding Elliott Wave Theory can help you decide whether it's a tool worth using or best left behind.

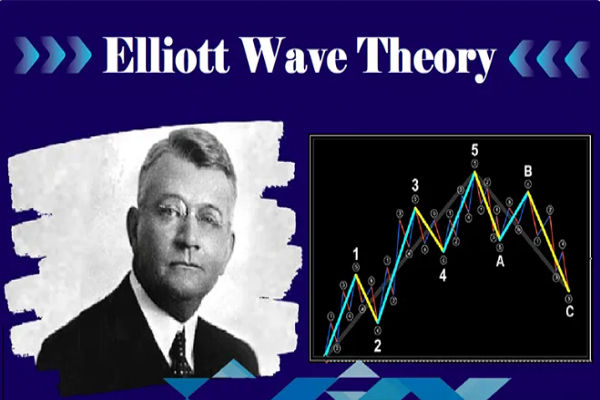
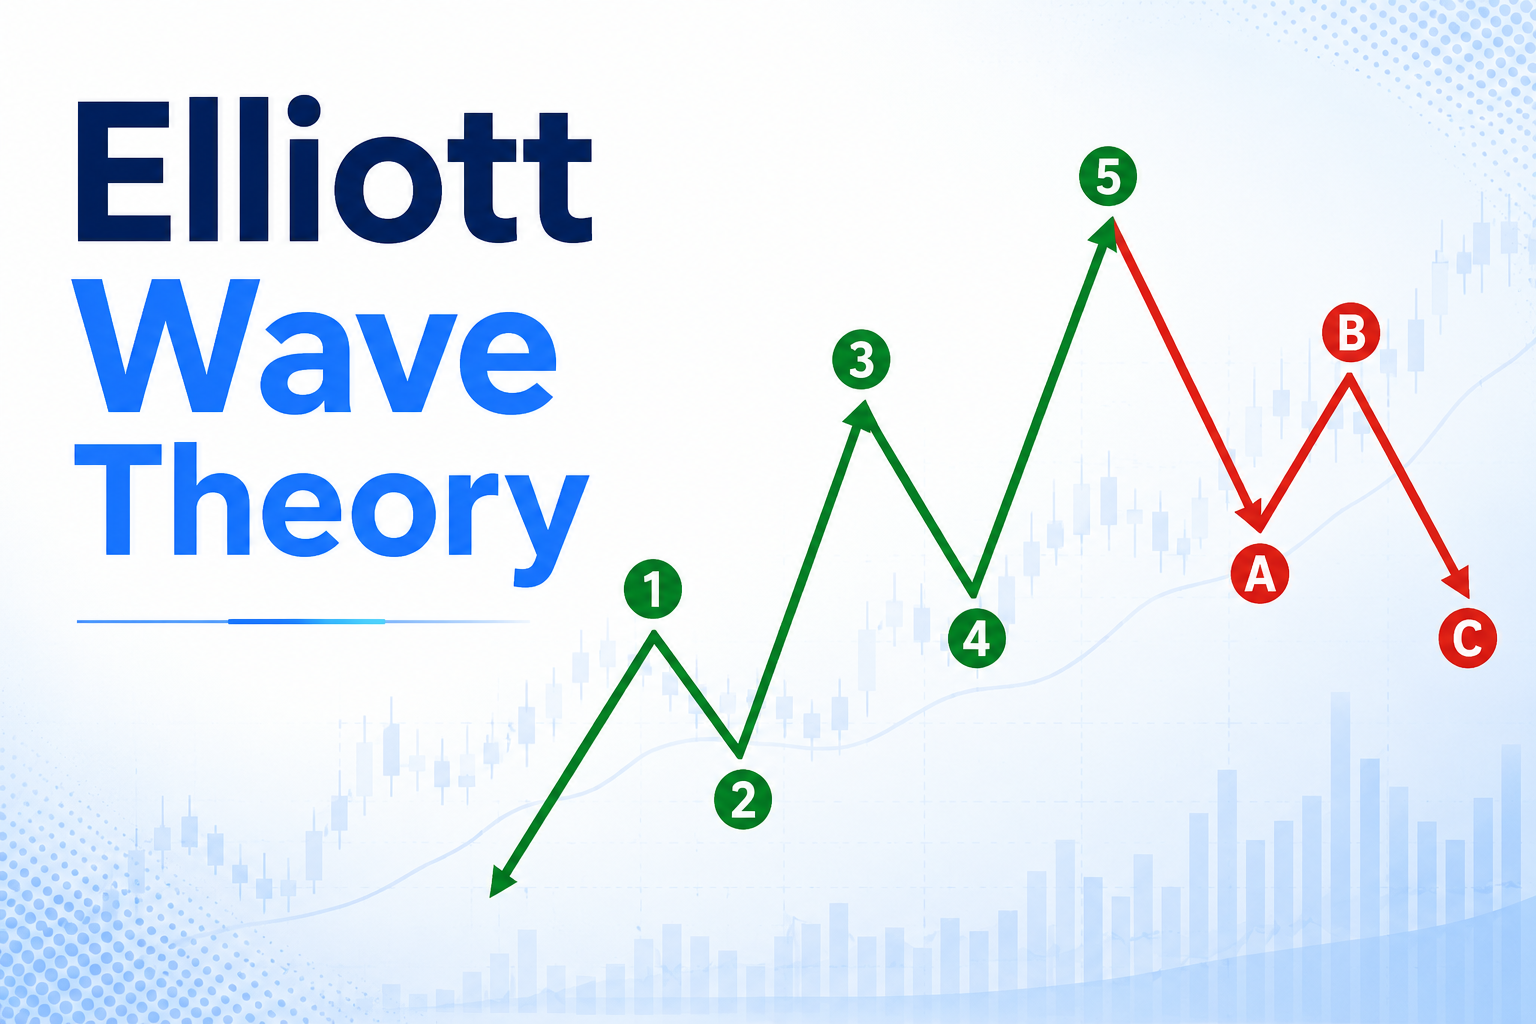
Elliott Wave Theory is a technical analysis framework developed by Ralph Nelson Elliott in the 1930s. It suggests that financial markets move in predictable cycles or "waves" driven by investor psychology. According to the theory, market prices follow a specific pattern of five waves in the direction of the primary trend, followed by three corrective waves in the opposite direction.
These waves are not just price movements; they reflect collective human behaviour. The theory's foundation lies in the idea that crowd psychology creates repetitive cycles, and by identifying these patterns, traders can anticipate market moves.
At the heart of Elliott Wave Theory are a few essential rules:
Wave 2 never retraces more than 100% of Wave 1.
Wave 3 is never the shortest among waves 1, 3, and 5.
Wave 4 never enters the price territory of Wave 1.
In theory, these rules make the structure reliable, but in practice, it often leads to multiple interpretations of a chart. That's one of the biggest criticisms against Elliott Wave Theory.
Elliott Wave Theory is mainly used for forecasting market direction, determining entry and exit points, and identifying potential reversal zones. Traders often combine it with Fibonacci ratios to determine the length and retracement of each wave.
The method is flexible, allowing users to apply it to different time frames. Whether analysing a 5-minute chart or a monthly trend, traders can apply Elliott Wave Theory to fit their strategy.

Many traders appreciate the structured approach Elliott Wave Theory offers. It gives a psychological angle to market analysis, allowing them to see beyond price action and into market sentiment.
Additionally, once traders master wave counting, they often report a deeper understanding of long-term trends and market cycles. For those who enjoy a methodical, pattern-driven analysis, Elliott Wave Theory can be extremely rewarding.
Despite its appeal, Elliott Wave Theory is not without flaws. Its biggest weakness lies in subjectivity. Two traders can look at the same chart and count entirely different waves. This lack of consistency reduces its reliability as a standalone strategy.
Furthermore, the theory doesn't always work in real-time trading. It's often easier to see the pattern in hindsight than in the moment. Critics argue that this makes it more descriptive than predictive.
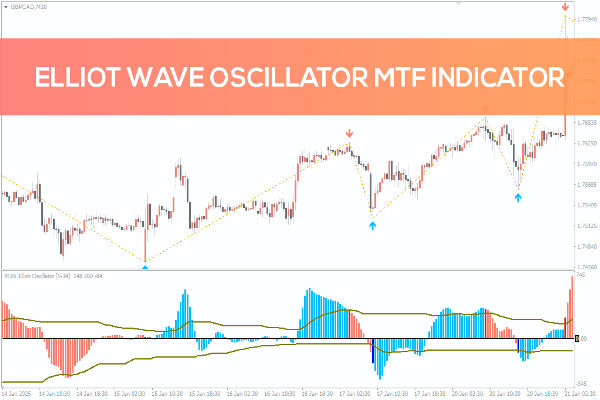
Compared to indicators like moving averages or oscillators, Elliott Wave Theory requires a more nuanced understanding. While traditional tools offer clear signals, Elliott Wave Theory often relies on experience and judgement.
Some traders choose to blend it with more objective tools to confirm wave counts and avoid misinterpretation. For example, combining the theory with RSI or MACD can strengthen trade setups.
That depends on your trading style. If you're a visual, analytical thinker who enjoys pattern recognition and doesn't mind some ambiguity, Elliott Wave Theory can add valuable insight. However, if you prefer fast, rule-based systems, it might frustrate more than help.
Many traders find it more useful for confirming broader market trends rather than pinpointing exact trade entries.
Elliott Wave Theory continues to divide the trading world. Some traders find it a powerful framework for understanding markets, while others view it as too subjective to rely on. Like any trading strategy, its effectiveness largely depends on how well it fits with your overall approach and mindset.
If you decide to explore it, do so with patience and a willingness to practice. The reward may not be instant, but the perspective it offers could change how you read the markets entirely.
Disclaimer: This material is for general information purposes only and is not intended as (and should not be considered to be) financial, investment or other advice on which reliance should be placed. No opinion given in the material constitutes a recommendation by EBC or the author that any particular investment, security, transaction or investment strategy is suitable for any specific person.