Published on: 2025-05-21
Updated on: 2025-05-21
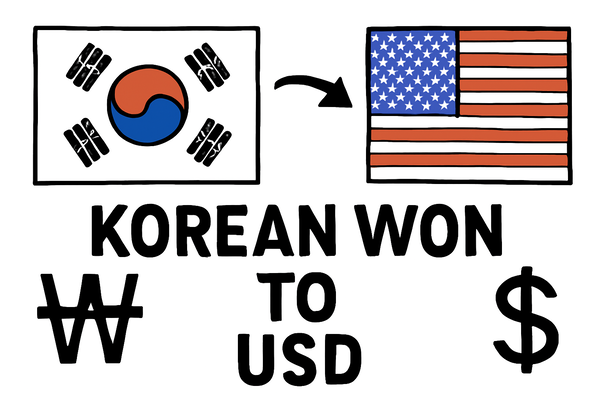
The South Korean won (KRW) to US dollar (USD) pair is a dynamic currency cross that attracts active traders and institutional investors alike. With the KRW/USD exchange rate experiencing notable volatility in 2025, technical analysis has become essential for those seeking to navigate short-term swings and identify potential trade setups.
This guide breaks down the latest chart insights, key indicators, and what traders should watch in the won to USD market.

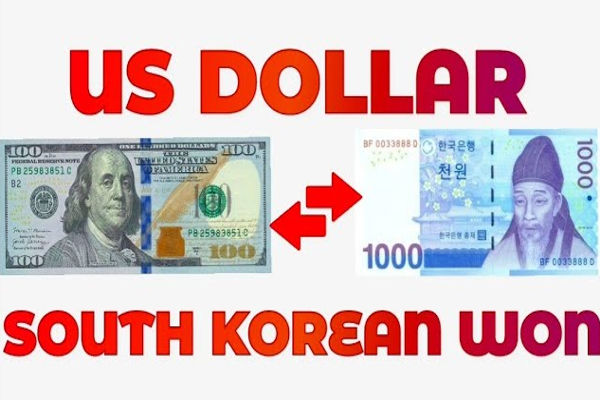
As of mid-May 2025, the KRW/USD rate trades near 1,401 won per US dollar, up from 1,345 a year ago and showing a 4.17% annual depreciation of the won.
The pair has seen sharp moves in recent months, with the won weakening to over 1,470 per dollar in early April before recovering some ground in May. This volatility has been driven by US–South Korea tariff negotiations, Bank of Korea policy changes, and broader risk sentiment.

1. Moving Averages
Moving averages help traders identify the prevailing trend and key support or resistance levels. On major charting platforms, the 20-day, 50-day, and 200-day simple moving averages (SMA) are widely used.
Short-term trend: The KRW/USD has recently traded below its 20-day SMA, indicating a potential short-term consolidation.
Medium-term trend: The 50-day and 200-day SMAs have acted as resistance zones during recent rallies, with the 1,420–1,440 range being a key technical area to watch.
2. Oscillators
Oscillators such as the Relative Strength Index (RSI), Stochastic Oscillator, and MACD provide insight into momentum and potential reversal points.
RSI: When the RSI approaches 70, the pair is considered overbought; below 30, it is oversold. In April, the KRW/USD RSI reached overbought territory before the recent pullback.
MACD: The MACD histogram has signalled bearish divergence during recent highs, suggesting waning upward momentum.
3. Support and Resistance Levels
Support: Key support is seen near 1,375–1,390, where buyers have previously entered the market.
Resistance: The 1,420–1,450 zone has capped several recent rallies, with a break above this level potentially opening the door to further won weakness.
Recent trading has seen the formation of consolidation ranges and potential reversal patterns. Double tops near 1,470 and double bottoms around 1,375 are worth monitoring for breakout or breakdown signals.
Trend direction: The medium-term trend remains bearish for the won, with the USD maintaining strength amid global risk aversion and ongoing trade talks.
Volatility spikes: Expect increased volatility around key events, such as Bank of Korea interest rate decisions or major US economic releases.
Breakout potential: A sustained move above 1,450 could trigger further won depreciation, while a break below 1,375 would signal a potential reversal and won recovery.
Tariff negotiations: US–South Korea trade talks are a major driver of KRW/USD volatility. Any resolution or escalation can result in sharp moves.
Central bank policy: The Bank of Korea's recent rate cut and future guidance will impact the won's direction. Watch for policy statements and inflation data.
US dollar trends: Broader USD strength or weakness, influenced by Federal Reserve policy and global sentiment, will continue to affect KRW/USD.
Use multiple timeframes: Analyse daily, weekly, and intraday charts to get a comprehensive view of trend and momentum.
Set stop-losses: Volatility can lead to rapid swings. Protect your capital with disciplined risk management.
Monitor economic calendars: Stay alert to scheduled events that could move the market, such as central bank meetings, trade announcements, and US non-farm payrolls.
Technical analysis is a powerful tool for navigating the won to USD market, especially in times of heightened volatility. By combining moving averages, oscillators, support and resistance, and chart pattern recognition, traders can identify high-probability setups and manage risk more effectively.
Keep an eye on key economic events and policy shifts, and use technical insights to stay ahead in the KRW/USD market.
Disclaimer: This material is for general information purposes only and is not intended as (and should not be considered to be) financial, investment or other advice on which reliance should be placed. No opinion given in the material constitutes a recommendation by EBC or the author that any particular investment, security, transaction or investment strategy is suitable for any specific person.