Published on: 2025-04-30
Updated on: 2025-04-30
In a world filled with noisy indicators and complex chart overlays, point and figure charts bring a refreshing level of clarity. Unlike typical time-based charts, they focus solely on price movements, stripping away market noise and helping traders make cleaner decisions.
While less mainstream than candlesticks or bar charts, they have remained a favourite among those who value precision, structure and pattern-based signals.
So what makes point and figure charts stand out, and why should modern traders pay more attention to them? Here are 10 key insights that can transform how you view price action and trend analysis.

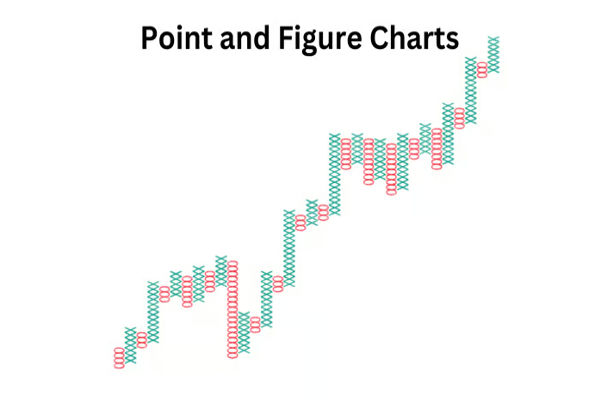
1. Point and Figure Charts Ignore Time Entirely
Unlike line or candlestick charts, point and figure charts do not plot time on the horizontal axis. This means that if the market is moving sideways, the chart does not change. Only significant price changes are recorded. This structure makes them ideal for filtering out indecision and focusing on meaningful price action.
2. They Are Built on Xs and Os
Point and figure charts use simple symbols — Xs for rising prices and Os for falling prices. Each column represents a direction. A reversal occurs only when the price moves a certain amount in the opposite direction. This makes the chart visually intuitive and ideal for spotting trends.
3. Customisable Box Sizes and Reversals
One of the unique features of point and figure charts is that you can set the box size (the minimum price movement) and the reversal size (how much the price must move in the opposite direction to start a new column). This flexibility allows traders to fine-tune the chart for different timeframes or asset classes, from volatile stocks to slow-moving currencies.
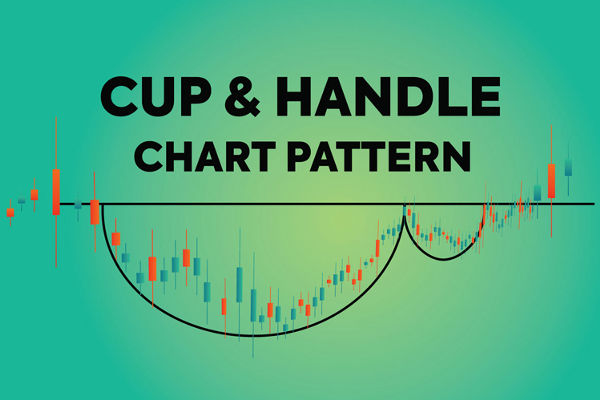
4. Price Patterns Still Apply
Just because they look different does not mean they are unfamiliar. Point and figure charts still use traditional Chart Patterns such as double tops, double bottoms, triangles and breakouts. In fact, many traders find these patterns easier to identify because of the chart's clean, noise-free layout.
5. Great for Defining Support and Resistance
Support and resistance levels become crystal clear on point and figure charts. Since the chart only moves when the price moves, areas of repeated reversal or hesitation are easily spotted and more likely to hold significance.
6. Ideal for Longer-Term Trading
Because the chart filter out small movements and ignore time altogether, they are often more useful for longer-term trades. Position traders and swing traders especially value them for defining trend direction and high-probability entry points without getting distracted by short-term volatility.
7. Widely Used in Risk Management
The structured layout of point and figure charts makes it easy to define risk. Traders often place stops just beyond the reversal points or breakout levels. The method's consistency helps in calculating risk-reward ratios and ensuring disciplined entries and exits.
8. They Reveal Clear Breakout Signals
Breakouts on point and figure charts are clean, unambiguous, and often reliable. Because the charts require a significant move to change direction, breakouts are less likely to be false signals caused by market noise. This is one of the reasons institutional traders often use point and figure charts for confirmation.
9. Not Dependent on Trading Sessions
Traditional charts can be affected by trading sessions, with gaps, wicks and volatile opens clouding the view. Point and figure charts, on the other hand, only record price changes. This makes them ideal for analysing instruments with irregular movement, such as oil, metals or forex pairs with low liquidity periods.
10. They Require Patience and Discipline
While they simplify decision-making, point and figure charts are not for trigger-happy traders. Their structure encourages patience, waiting for clear patterns and signals before acting. This built-in discipline is part of what makes them so effective, especially for traders who struggle with Overtrading or emotional decisions.
In an era dominated by AI and algorithmic systems, why would something as minimalist as point and figure charts still hold value? Because simplicity cuts through complexity. By removing time and noise, they present the market in a raw, unfiltered form.
They offer a valuable second opinion, especially when other charts feel unclear or conflicting. And for traders who want a long-term edge with better-defined setups, point and figure charts are a timeless tool that has earned its place in modern trading arsenals.
Disclaimer: This material is for general information purposes only and is not intended as (and should not be considered to be) financial, investment or other advice on which reliance should be placed. No opinion given in the material constitutes a recommendation by EBC or the author that any particular investment, security, transaction or investment strategy is suitable for any specific person.