The Laguerre RSI is a powerful tool for analysing momentum and identifying high-probability entry and exit points in the financial markets. While it may sound like a complex indicator reserved for seasoned traders, the truth is quite the opposite. With a basic understanding of its function and setup, even beginner traders can take full advantage of the Laguerre RSI to enhance their strategies.
In this article, we will explore what the Laguerre RSI is, how it works, and most importantly, how traders of all experience levels can benefit from its application.
What Is Laguerre RSI?
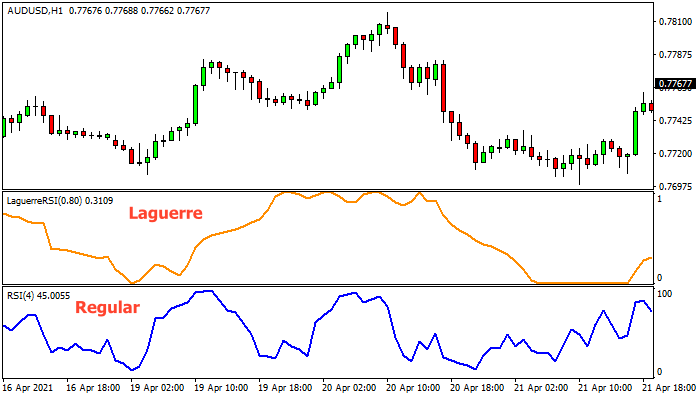
Laguerre RSI is a variation of the traditional Relative Strength Index (RSI), designed to reduce noise and provide smoother, more responsive signals. Developed by John Ehlers, it uses a mathematical technique known as the Laguerre transform to create a filtered version of RSI. This makes it easier to identify genuine trend shifts and overbought or oversold conditions.
Unlike the standard RSI, which often reacts sharply to price movements and can give false signals in choppy markets, the Laguerre RSI is less sensitive to short-term fluctuations. As a result, it provides a clearer picture of momentum and trend strength.
Why Laguerre RSI Is Not Just for Advanced Traders
One of the biggest misconceptions about Laguerre RSI is that it's too complicated for beginners. While the formula behind it may involve more advanced mathematics, using the indicator in practice is straightforward. Most trading platforms offer Laguerre RSI as a built-in option or via custom indicators, so no manual calculation is required.
New traders can easily learn to read the Laguerre RSI chart and use its signals to confirm entries, exits, and overall market direction. With a few simple guidelines, it becomes just as accessible as any standard indicator.
How to Read
Laguerre RSI typically moves between 0 and 1. Key levels to watch are 0.15 and 0.85, which indicate oversold and overbought conditions respectively. When the indicator crosses above 0.85, the asset may be overbought, suggesting a potential reversal or pullback. A cross below 0.15 indicates oversold conditions and a possible bullish reversal.
These levels serve as alerts for traders to prepare for action, either by entering a trade in the direction of a new trend or by taking profit on an existing position.
How Advanced Traders Use the Laguerre RSI
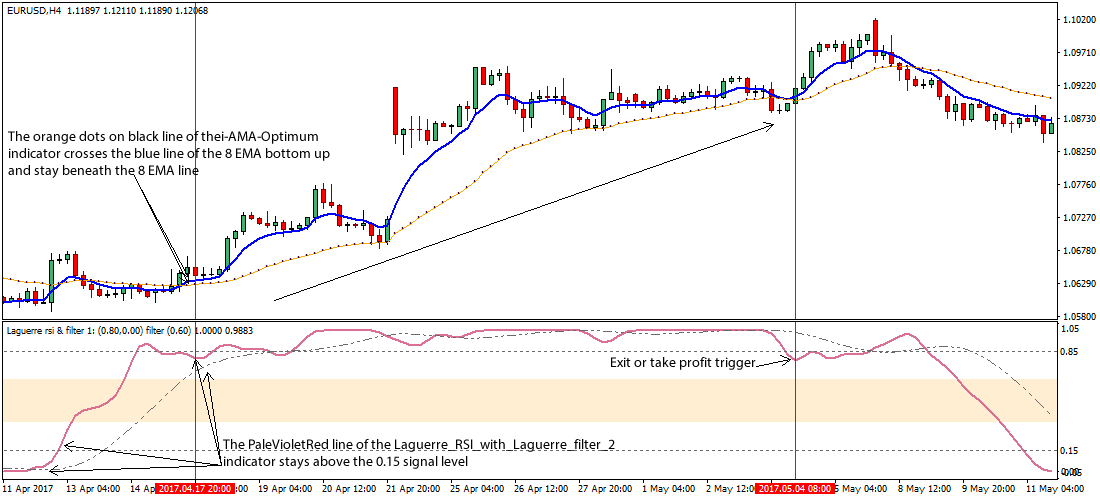
1. For Entry Signals
One of the most practical uses of Laguerre RSI is for identifying precise entry points. When the line moves upward and crosses above 0.2 or 0.3, it suggests increasing bullish momentum. Traders often use this signal to enter long positions.
Conversely, a drop below 0.7 or 0.8 can indicate growing bearish pressure and signal the beginning of a downward move. This is a common trigger for short positions.
Beginners can use these simple threshold crossings to guide entries without relying on complex strategies.
2. Combining with Price Action
To improve accuracy, traders can combine Laguerre RSI with price action techniques. For example, if the price forms a bullish candlestick pattern near a support level while Laguerre RSI is rising from below 0.15, this double confirmation strengthens the case for a long trade.
Similarly, a bearish candlestick near resistance combined with Laguerre RSI falling from above 0.85 supports a short entry. This blending of tools creates more confidence in trade decisions and reduces false signals.
3. Applying in Trending vs Sideways Markets
Laguerre RSI adapts well to different market conditions. In trending markets, it helps confirm the strength of the trend. If Laguerre RSI stays above 0.5 during an uptrend, it indicates continued bullish pressure.
In sideways or ranging markets, the indicator becomes more valuable as a reversal tool. Traders can look for oscillations between the upper and lower levels (around 0.15 and 0.85) to catch turning points within the range.
Understanding the market context is key to applying Laguerre RSI effectively across various trading environments.
4. Laguerre RSI with Multiple Time Frames
One powerful way to enhance trading results is to use Laguerre RSI across multiple time frames. For example, if the indicator shows bullish momentum on a daily chart and also crosses upwards on an hourly chart, it strengthens the overall signal.
This technique allows traders to align short-term entries with long-term trends, improving the probability of success. Multi-timeframe analysis also helps filter out noise and avoid poor entries that contradict the broader market direction.
5. Adjusting Laguerre RSI Settings for Your Strategy
While many traders stick with the default Laguerre RSI settings, the indicator can be customised for different asset classes and time frames. The "gamma" value, which controls the smoothing, can be adjusted to make the indicator more or less sensitive.
A lower gamma value will produce a quicker response, suitable for fast-moving assets like forex or crypto. A higher gamma creates a smoother line, which works better for swing trading or slower instruments like major indices.
Experimenting with different settings allows traders to tailor the indicator to fit their personal trading style.
Final Thoughts
The Laguerre RSI is a versatile and beginner-friendly tool that provides valuable insights into momentum and price behaviour. Its ability to filter noise and give smoother signals makes it especially useful in volatile markets.
Traders do not need to be experts to use Laguerre RSI effectively. By understanding its basic signals, combining it with other tools, and practising on demo accounts, even novice traders can use this advanced-sounding indicator with confidence. It is a practical, flexible tool that belongs in every trader's technical analysis toolkit, regardless of experience level.
Disclaimer: This material is for general information purposes only and is not intended as (and should not be considered to be) financial, investment or other advice on which reliance should be placed. No opinion given in the material constitutes a recommendation by EBC or the author that any particular investment, security, transaction or investment strategy is suitable for any specific person.
