Published on: 2025-07-15
Updated on: 2025-07-15
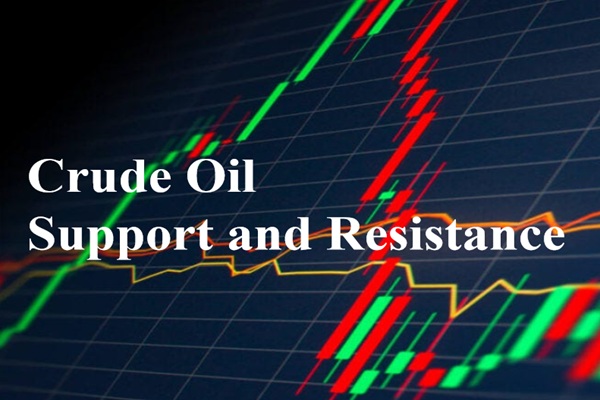
Crude oil, as one of the most actively traded commodities globally, attracts significant attention from traders seeking to capitalise on price fluctuations driven by both technical and fundamental factors. One of the most important tools in the technical trader's arsenal is the identification of support and resistance levels—critical price zones where oil tends to reverse, consolidate, or accelerate its movement.
Understanding how to identify and interpret these levels can offer actionable trade setups, risk control, and clearer decision-making in the fast-paced crude oil market.

Pivot points are among the most popular intraday technical tools used by oil traders. They are calculated using the previous day's high, low, and close prices and provide a framework for anticipating support and resistance levels during the current trading session.
The standard formula for the pivot point (PP) is:
PP = (High + Low + Close) / 3
Once the pivot point is calculated, traders derive three levels of resistance (R1. R2. R3) and three levels of support (S1. S2. S3). These levels often act as intraday price magnets, especially in the WTI and Brent crude markets.
For example, if crude oil is trading above the pivot point, traders typically view R1 and R2 as potential resistance, while the pivot itself may act as support on pullbacks. Conversely, if the price opens below the pivot, traders watch S1 and S2 as targets.
Pivot-based levels are particularly useful during Asian and London trading hours, where oil often ranges before the New York session provides direction.
Moving averages (MAs) are dynamic support and resistance levels that change with price action. Crude oil traders often monitor short-term averages such as the 9-EMA (Exponential Moving Average) or 21-EMA for momentum trends, and longer-term averages such as the 50-, 100-, and 200-day MAs for broader structural insight.
When oil prices approach a key moving average from above, the average may act as support; from below, it often acts as resistance. For instance:
The 200-day SMA (Simple Moving Average) is frequently referenced by institutional traders. If oil breaks below it, it is often seen as a signal of a bearish shift in trend.
The 50-day EMA is popular among swing traders seeking short- to medium-term direction.
Crossovers between these averages—such as the golden cross (50-day MA crossing above the 200-day) or death cross (50-day crossing below the 200-day)—can also signal important inflection points in support/resistance dynamics.
 Another powerful method to find support and resistance in crude oil is through Fibonacci retracement levels. Traders use this tool to identify potential reversal zones based on historical price swings.
Common retracement levels include:
23.6%
38.2%
50%
61.8%
78.6%
For example, if WTI crude oil rallied from $65 to $80. traders would mark Fibonacci retracement levels at $76.82 (23.6%), $74.29 (38.2%), $72.50 (50%), and $70.21 (61.8%) to anticipate potential areas of support during a pullback.
These levels often coincide with historical price congestion, increasing their relevance. They are most effective when used in conjunction with other indicators, such as trendlines or RSI divergences, to strengthen the signal.
Trendlines are another cornerstone of support and resistance analysis. They are drawn by connecting either higher lows (in an uptrend) or lower highs (in a downtrend) and extend forward to predict future price interaction.
For crude oil traders, trendlines help to:
Identify ascending or descending channels
Spot breakouts or breakdowns
Validate wedge, triangle, or flag formations
For instance, a rising trendline connecting successive lows in WTI over the past several weeks could act as a dynamic support. If the price breaks that trendline decisively, it may indicate a short-term bearish reversal.
Combining chart patterns such as head and shoulders, double tops/bottoms, or symmetrical triangles with trendline analysis enhances reliability. These patterns often reveal volume-backed turning points, giving traders an edge in setting entries and stop-loss levels.
In all markets—but particularly in commodities like crude oil—round numbers such as $70. $75. $80. and $100 often serve as psychological support and resistance zones. These levels become self-fulfilling due to:
Stop orders clustering just above or below
Options traders placing significant strike volume near these levels
Media and analyst focus magnifying their importance
Traders frequently observe sharp reactions when prices approach these milestones. For example, a break above $80 per barrel may trigger a momentum-driven breakout, while failure at that level could lead to a retracement back toward previous support.
These psychological levels are especially relevant during geopolitical events, OPEC+ announcements, or major economic releases such as US inventory data or inflation reports.
Navigating the complex and often volatile crude oil market requires more than just watching the news. For traders, the ability to identify and react to support and resistance zones is critical. Whether through daily pivots, dynamic moving averages, Fibonacci retracements, trendline formations, or psychological round numbers, understanding how price interacts with key levels offers a roadmap for potential entries, exits, and risk management.
While no method is infallible, using a confluence of technical tools significantly improves confidence in trade direction. With oil prices increasingly sensitive to both geopolitical and economic drivers, combining fundamental awareness with strong technical discipline remains the hallmark of successful trading in this dynamic market.
Disclaimer: This material is for general information purposes only and is not intended as (and should not be considered to be) financial, investment or other advice on which reliance should be placed. No opinion given in the material constitutes a recommendation by EBC or the author that any particular investment, security, transaction or investment strategy is suitable for any specific person.