2023-06-05
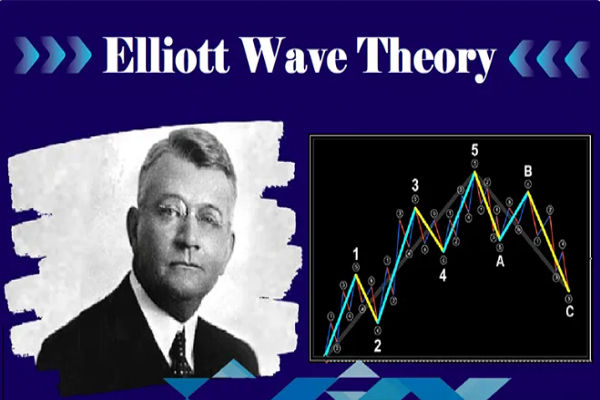
The wave theory is based on the use of the dow jones industrial average by American Securities analyst Ralph Nelson ElliottAverage (DJIA) is a theory created as a research tool.

Based on this discovery, he proposed a set of relevant market analysis theories, refining the 13 forms of the market (Patte · rn) or waves, which repeatedly appear in the market, but the time interval and magnitude of their occurrence may not necessarily be reproducible. Then he discovered that these structural shapes could be connected to form larger shapes of the same type. In this way, a series of authoritative deductive rules were put forward to explain the behavior of the market, with special emphasis on the predictive value of the volatility principle, which is the well-known Eliot Wave Theory.
Elliott Wave TheoryWaveTheory is a theory of stock technical analysis. Believing that the market trend is constantly repeating a pattern, each cycle consists of 5 upward waves and 3 downward waves. Eliot's wave theory divides trends of different scales into nine categories, the longest super large cyclic wave (grandSupercycleIt is a super large cycle spanning 200 years, while subminuette only covers the trend within a few hours. However, regardless of the scale of the trend, the fact that each cycle is composed of 8 waves remains unchanged.
The premise of this theory is that when the stock price follows the main trend, it fluctuates in the order of five waves, and when it goes against the main trend, it fluctuates in the order of three waves. Long waves can last for over 100 years, while the duration of secondary waves is quite brief.
The Three Principles of Waves
Correction wave depth principle
Used to measure the amplitude of correction wave retreat, usually the correction wave reaches a lower level near the low point of 4 waves. In a strong market, only breaking new highs and not breaking new lows, a small level of 4 wave lows at this time would be a good support level, which can be used to follow up with stop losses.
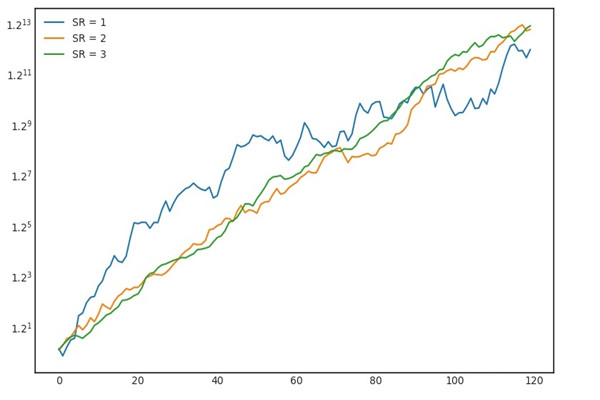
Golden Section Principle
The volatility ratio presents the golden ratio. For example, 3 waves are 1.618, 2.618... of 1 wave; 2 waves were adjusted back to 1 wave at 0.382, 0.5, and 0.618; The 4 waves were adjusted back to 0.382 and 0.5 of the 3 waves; 5 waves are 0.618 of 1-3 waves. This principle is also presented in terms of time.
1. The golden ratio can not only help us to enter the market well, but also to enter the market well. If you can integrate with the market, these mysterious golden figures will become your lifelong partner.
2. 1.618 can be reversed to determine whether the three waves in front of you are the real three waves. If the three waves cannot even reach 1.618 of one wave, then it is likely not three waves. If you can judge that the market is about to experience a prolonged trend, then the market usually reaches the 2.618 times position of the previous wave, providing a very good reference target.
3. At the beginning of the trend, the retracement amplitude is mostly 0.618, and if the retracement is carried out in a platform shape, it is mostly 0.5; In the middle of the trend, as the trend gradually becomes apparent, the probability of the market retreating from 0.618 begins to decrease, and instead, it is expected to lean towards a correction level of 0.5.
Alternating principle
That is, simplicity and complexity, rise and fall, push and adjustment, rules and irregularity. The correction wave exhibits alternating phenomena. If wave 2 is serrated, wave 4 may be flat or triangular, and vice versa; This phenomenon also exists in terms of time. If wave 2 experiences a sharp pullback, wave 4 may undergo complex adjustments for a long time, and vice versa; In terms of complexity, if 2 waves are simple, then 4 waves are complex, and vice versa. If the second wave is' compound ', then the fourth wave may be' singular '.
1. A small adjustment matches a small push, and a medium adjustment also indicates a medium drive. A large adjustment accumulates a wave of significant push in the market. If there is a small level adjustment in front of you, plan for a small push, and if there is a large level adjustment, plan for a large push.
2. If there is a simple adjustment in Wave 2, then Wave 4 often undergoes complex adjustments. If the adjustment time for Wave 2 is very short, it can be basically determined that the adjustment time for Wave 4 will not be very short, and known information can be used to predict the upcoming situation, thereby improving the chances of winning the operation. If 2 waves go out of a very regular shape, it is important to note that 4 waves can go out of an irregular shape.
【 EBC Platform Risk Reminder and Disclaimer 】: There are risks in the market, and investment needs to be cautious. This article does not constitute investment advice.