With technology, innovation, and consumer demand reshaping the global economy, growth investing has taken centre stage. The iShares Russell 1000 Growth ETF (IWF) captures this momentum by targeting America's most dynamic large-cap companies—those leading in revenue expansion, market influence, and long-term potential. From Apple to Amazon, IWF offers investors a streamlined way to tap into the performance of industry-defining names through a single, diversified vehicle.
Fund Overview & Strategy
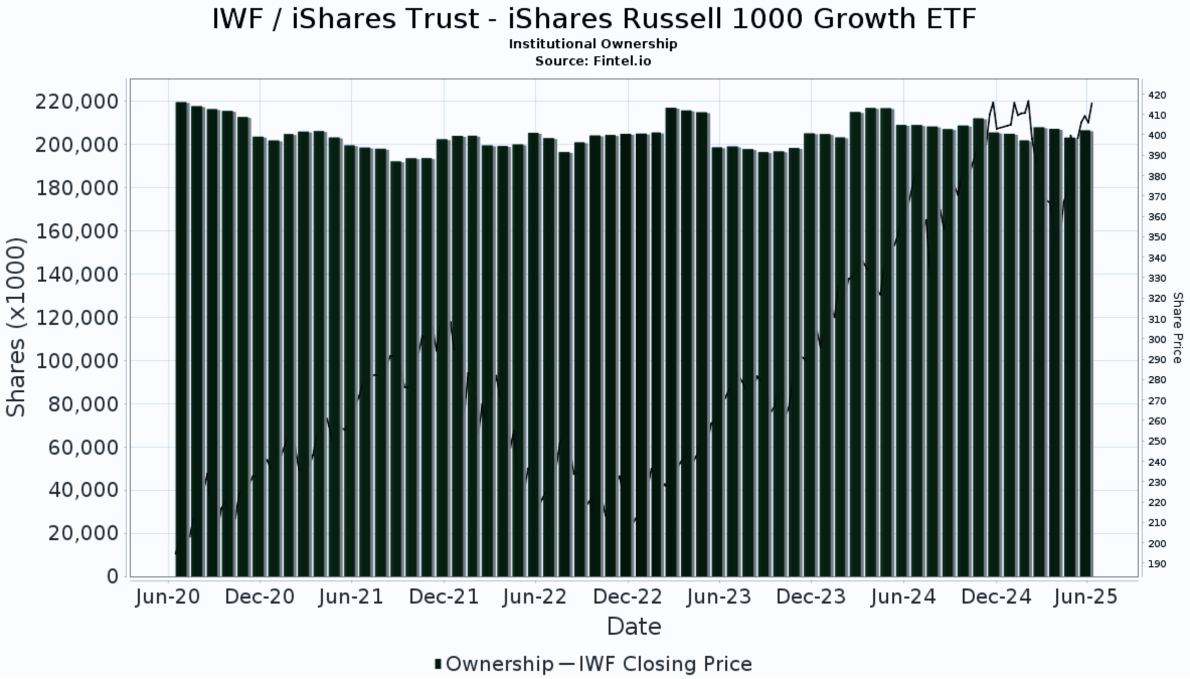 Launched in May 2000. the iShares Russell 1000 Growth ETF is designed to track the performance of the Russell 1000 Growth Index, which comprises approximately the top half (by market capitalisation) of the largest 1.000 US-listed stocks, with a focus on companies that exhibit above-average growth characteristics.
Managed by BlackRock, IWF seeks to capture firms with strong earnings growth, high return on equity, and forward-looking valuations. These growth companies are typically reinvesting profits to expand operations rather than paying out dividends, making IWF ideal for those targeting capital appreciation.
Key features:
Ticker: IWF
Index Tracked: Russell 1000 Growth Index
Fund Manager: BlackRock
Listing Exchange: NYSE Arca
Structure: Open-ended ETF
IWF allows investors to gain broad exposure to US large-cap growth stocks with a single investment, making it a popular core holding within growth-oriented portfolios.
Key Fund Facts & Metrics
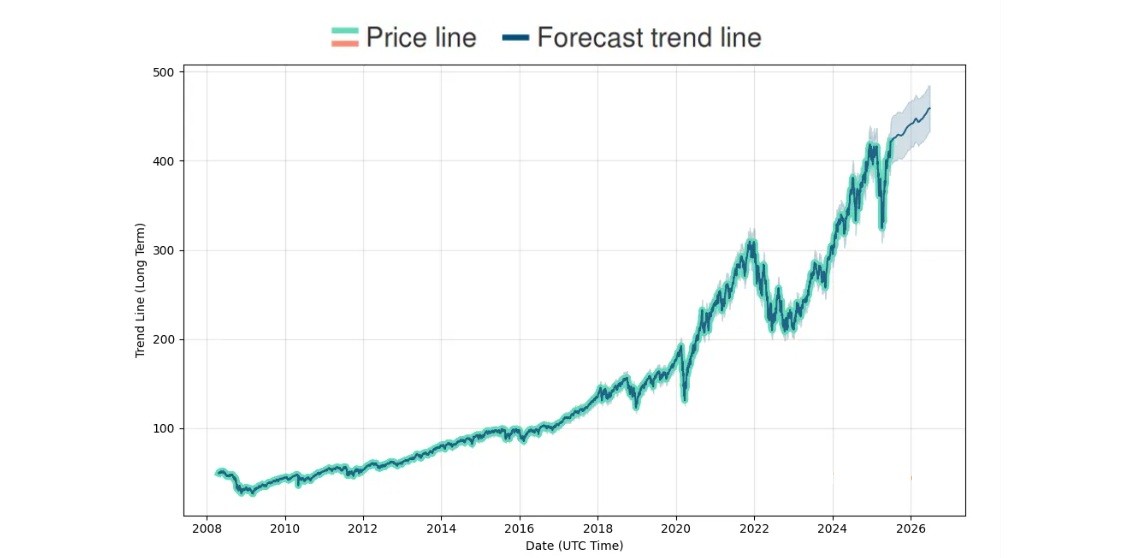 The fund is one of the largest and most liquid ETFs in its category. As of mid-2025. IWF manages over $106 billion in assets under management (AUM), reflecting widespread institutional and retail investor confidence.
Key Metrics:
Assets Under Management (AUM): ~$106–108 billion
Expense Ratio: 0.19% per annum
Inception Date: 22 May 2000
Average Daily Volume: High liquidity, typically exceeding 2 million shares traded daily
Number of Holdings: Over 400 individual securities
Rebalancing Frequency: Annually (aligned with Russell indices)
Despite tracking a broad index, the top 10 holdings account for around 45% of the portfolio, which reflects the market cap–weighted structure and strong performance of mega-cap tech names.
The ETF's low cost and high liquidity make it an attractive choice for investors seeking both efficiency and flexibility in accessing growth equities.
Top Holdings & Sector Allocation
IWF's portfolio is heavily concentrated in technology and consumer discretionary sectors, which aligns with the growth-driven nature of the companies in the index. These companies tend to have strong innovation pipelines, scalable business models, and significant revenue growth potential.
Top Holdings (as of June 2025):
These ten names alone make up roughly 40–45% of the fund's total weighting, underlining IWF's tilt towards mega-cap tech stocks.
Sector Allocation:
Information Technology: ~46%
Consumer Discretionary: ~17%
Communication Services: ~12%
Healthcare: ~10%
Industrials: ~6%
Financials & Others: Remaining share
Investors should be mindful of this sector concentration, as it makes the fund more sensitive to developments in the tech industry and interest rate cycles that disproportionately affect growth stocks.
Performance Track Record
IWF has delivered strong long-term returns, driven by the outsized growth of its top holdings and the secular trends favouring technology and digitalisation.
Recent Performance (as of Q2 2025)*:
(*Returns are approximate and subject to market fluctuation)
Compared to broader market ETFs such as SPY (S&P 500) or VTI (Total stock market), IWF often outperforms in bull markets due to its growth focus, but it may underperform in periods of market correction or when value stocks outperform growth.
Volatility & Risk Metrics:
These figures reflect the higher volatility profile typical of growth equity ETFs but also show the potential for outsized returns over time.
Dividend Policy & Tax Considerations
Although IWF primarily targets capital growth, it also provides modest dividend income, which can appeal to income-conscious investors looking for diversified growth exposure.
Dividend Details:
Dividend Yield: ~0.4% to 0.7% (variable)
Distribution Frequency: Quarterly
Dividend Type: Qualified dividends, taxed at capital gains rates in most cases
Ex-Dividend Schedule: Typically announced in March, June, September, and December
Dividends are relatively low due to the nature of the companies in the fund, many of which reinvest earnings rather than distribute them. From a tax perspective, investors holding IWF in a taxable account may need to consider capital gains distributions, though ETFs are generally tax-efficient due to their structure.
Conclusion
The iShares Russell 1000 Growth ETF (IWF) provides investors with an efficient and well-constructed gateway into the world of large-cap US growth equities. With a strong performance track record, low fees, high liquidity, and exposure to market-leading companies, IWF stands as a compelling option for long-term growth-focused investors.
However, like all investment vehicles, IWF comes with trade-offs: sector concentration, sensitivity to market cycles, and limited dividend income. Still, for those seeking to capitalise on innovation, tech-driven disruption, and long-term wealth creation, IWF remains a powerful and popular choice in the ETF universe.
Disclaimer: This material is for general information purposes only and is not intended as (and should not be considered to be) financial, investment or other advice on which reliance should be placed. No opinion given in the material constitutes a recommendation by EBC or the author that any particular investment, security, transaction or investment strategy is suitable for any specific person.


 Launched in May 2000. the iShares Russell 1000 Growth ETF is designed to track the performance of the Russell 1000 Growth Index, which comprises approximately the top half (by market capitalisation) of the largest 1.000 US-listed stocks, with a focus on companies that exhibit above-average growth characteristics.
 The fund is one of the largest and most liquid ETFs in its category. As of mid-2025. IWF manages over $106 billion in assets under management (AUM), reflecting widespread institutional and retail investor confidence.


