Published on: 2025-05-19
Gold has long been considered a safe haven asset, especially in uncertain times. But knowing when to buy, hold or sell gold isn't just about gut feeling—it often comes down to understanding price charts and spotting trends. If you're curious about how to read gold price charts without getting lost in complex jargon, this guide will walk you through the essentials, step by step.

Most traders and analysts rely on candlestick charts to interpret gold price movements. At first glance, they may look like a series of coloured blocks, but each candlestick tells a story about what buyers and sellers were doing within a specific time period—be it a minute, a day, or even a month.

Each "candle" shows four key data points: the opening price, closing price, highest price, and lowest price for that time frame. If the candle is green (or white, depending on the chart), it means the price went up during that period. If it's red (or black), the price went down.
What makes candlestick charts so useful is how they show patterns. A single candle can reflect hesitation or momentum. A group of them can signal potential reversals or the continuation of a trend. Once you get the hang of recognising common patterns—like "doji", "engulfing", or "hammer"—you start to see more than just shapes; you see trader behaviour in action.
As you look through gold charts, you might notice prices often bounce off certain levels repeatedly. These are known as support and resistance zones. Support is where the price tends to stop falling and bounce back up—almost like a floor. Resistance is the opposite: it's where price rallies tend to stall, acting like a ceiling.
 Understanding these levels is crucial. If gold has bounced off $1.850 several times, that's a clear support zone. If it struggles to get past $2.000. that's likely a strong resistance. These zones help traders plan their entries and exits. For example, buying near support and selling near resistance can be a low-risk strategy when combined with other indicators.
Support and resistance don't always stay fixed, though. A resistance level that gets broken could become new support, and vice versa. Watching how price behaves around these levels gives great insight into market sentiment.
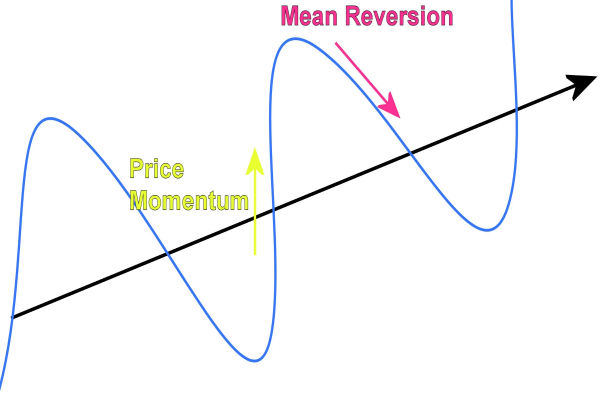
Before making any trading decision, it's important to identify what kind of trend gold is in. Is it climbing steadily, losing ground, or just moving sideways? You don't need to overcomplicate this—just draw a few lines and observe the price direction over time.
An uptrend is marked by higher highs and higher lows. In other words, each rally goes further, and each dip doesn't fall as low as the last. A downtrend is the reverse—lower highs and lower lows. When gold moves sideways, it means the market is undecided, with price bouncing between the same support and resistance levels.
Trendlines can help you see this clearly. Draw a line connecting the lows in an uptrend or the highs in a downtrend. If gold is moving steadily along that line, you've got a strong trend on your hands. Recognising the trend early can be a huge advantage, especially if you're planning to trade over the short or medium term.
Once you've got a handle on candlesticks and trendlines, the next step is learning about chart patterns. These are formations that often hint at where the price is headed next. Think of them as the market's body language.
Some patterns suggest continuation—like flags, pennants, or ascending triangles—where the price takes a quick pause before resuming the trend. Others hint at reversal—such as head and shoulders, double tops, or falling wedges—and can be early signs that the market is about to shift direction.
Let's say gold has been rising for weeks, but suddenly forms a "head and shoulders" pattern near a resistance level. That could be a warning sign of an upcoming reversal. Of course, nothing is guaranteed, but recognising these shapes helps you prepare for what might happen next, rather than reacting too late.
Technical analysis is powerful, but it becomes far more effective when you combine it with price action—that is, simply observing how price behaves without relying too heavily on indicators.
For instance, if gold approaches a key support level and you see a long lower shadow on a candlestick (meaning the price dipped low but buyers quickly pushed it back up), that's a bullish sign. Or if price nears resistance and you notice smaller candles with little movement, that could be a sign of weakening momentum.
Price action helps confirm what your charts are suggesting. It adds that extra layer of confidence. And over time, the more you practise, the better your instincts become—whether you're reading a breakout, a reversal, or simply a quiet consolidation.
Technical analysis doesn't need to be overly complicated. By learning to read candlestick charts, recognising support and resistance zones, identifying trends, spotting patterns, and paying attention to price behaviour, you can gain a far clearer view of how the gold market moves.
Even if you're not looking to become a full-time trader, these skills can help you better time your decisions—whether you're investing for the long run or keeping an eye on short-term opportunities. Gold may not speak, but with the right tools, it certainly tells a story—and now you've got a good idea of how to read it.
Disclaimer: This material is for general information purposes only and is not intended as (and should not be considered to be) financial, investment or other advice on which reliance should be placed. No opinion given in the material constitutes a recommendation by EBC or the author that any particular investment, security, transaction or investment strategy is suitable for any specific person.