Publicado el: 2023-10-31
Actualizado el: 2026-05-18
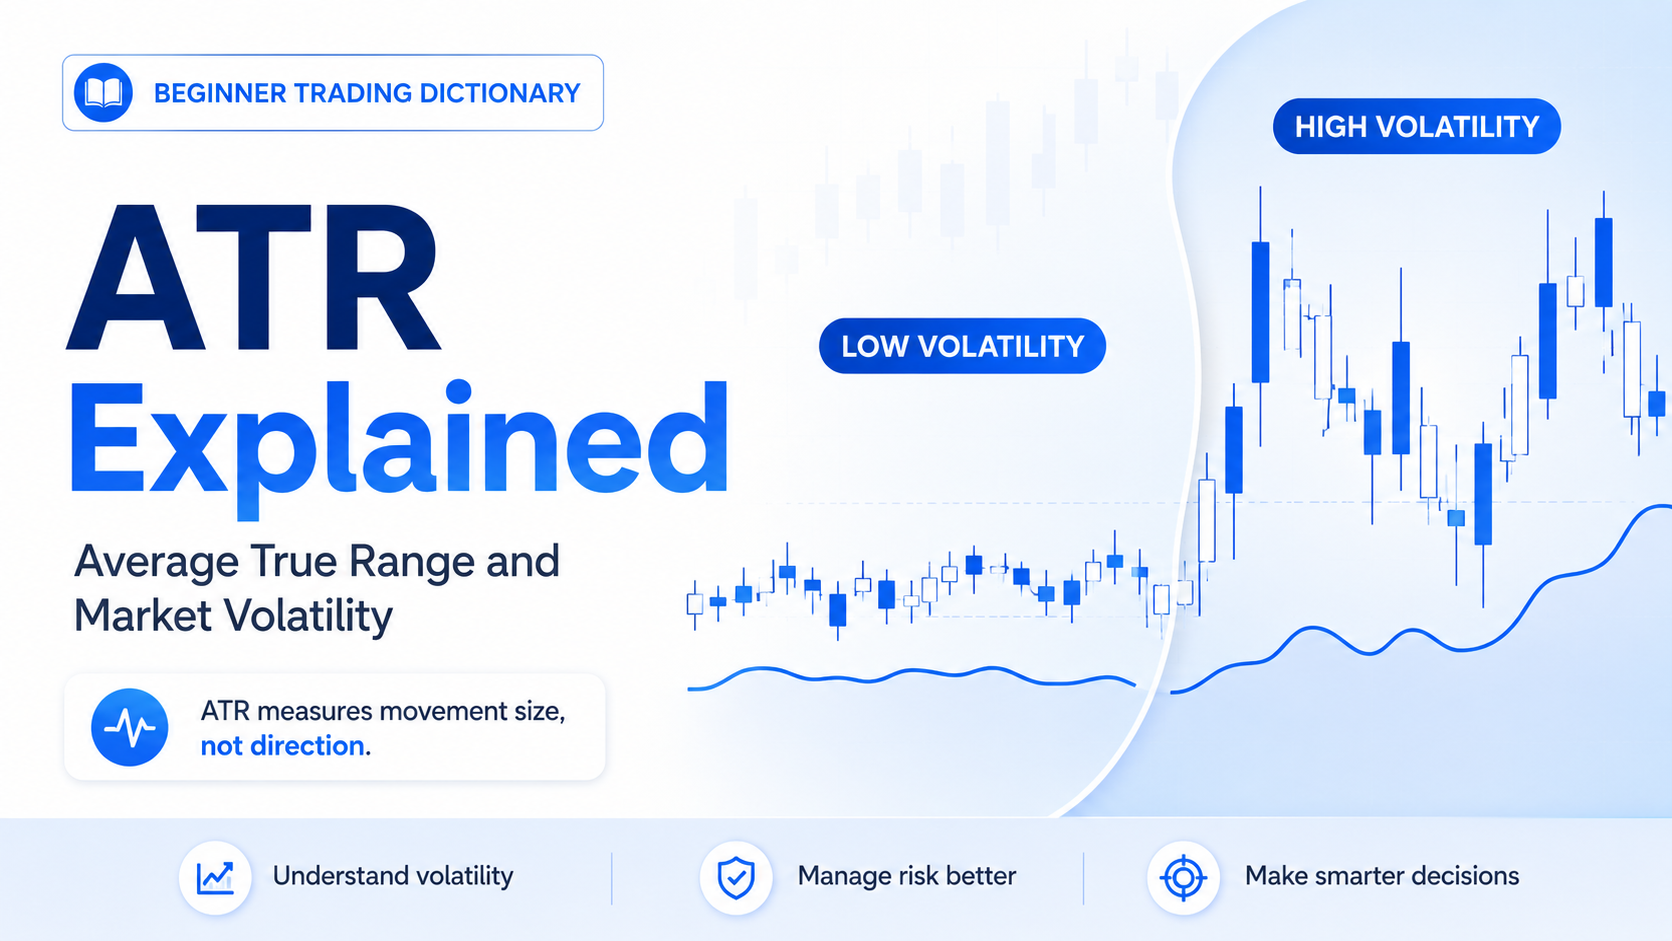
El rango verdadero promedio es una de las formas más sencillas de responder una pregunta que todo trader se plantea: ¿cuánto se mueve realmente este mercado? La dirección del precio es importante, pero la volatilidad determina si un stop loss es demasiado ajustado, si una ruptura tiene suficiente fuerza y si el tamaño de posición es realista.
Esto hace que el ATR sea especialmente útil en los mercados actuales. En 2025. las noticias sobre aranceles generaron una alta volatilidad en divisas y se alcanzó un volumen diario récord de 9.51 billones de dólares en el mercado forex durante el periodo de estudio del BIS. Para 2026, la volatilidad se suavizó en algunos pares de divisas, aunque la demanda de coberturas se mantuvo firme. El ATR permite a los traders adaptarse cuando la volatilidad se expande, se contrae o se alterna entre divisas, oro, índices y materias primas.
El ATR mide volatilidad, no dirección del precio. Un ATR en alza indica ampliación de rangos, pero no señala si comprar o vender.
Ayuda a configurar stops loss teniendo en cuenta el ruido del mercado. Un stop de 2 veces el ATR otorga más margen que un stop fijo de 20 pips en escenarios de alta actividad.
Mejora la gestión del tamaño de posición: al subir el ATR, se suele reducir el volumen de operación para mantener estable el riesgo de la cuenta.
Es válido para forex, oro, acciones, índices y futuros. Sus valores varían según el activo, por lo que se debe comparar el ATR en relación al precio y el temporalidad.
Funciona mejor combinado con estructuras de mercado: soportes, resistencias, líneas de tendencia, medias móviles, RSI o acción del precio.
El Rango Verdadero Promedio (ATR) es un indicador técnico creado por J. Welles Wilder en 1978. Fue diseñado originalmente para materias primas y hoy se usa ampliamente en divisas, acciones, índices, oro, petróleo y futuros.
Mide el movimiento promedio del precio durante un periodo definido. El ajuste estándar es de 14 periodos, que pueden ser 14 velas diarias, horarias o de cinco minutos según el gráfico.
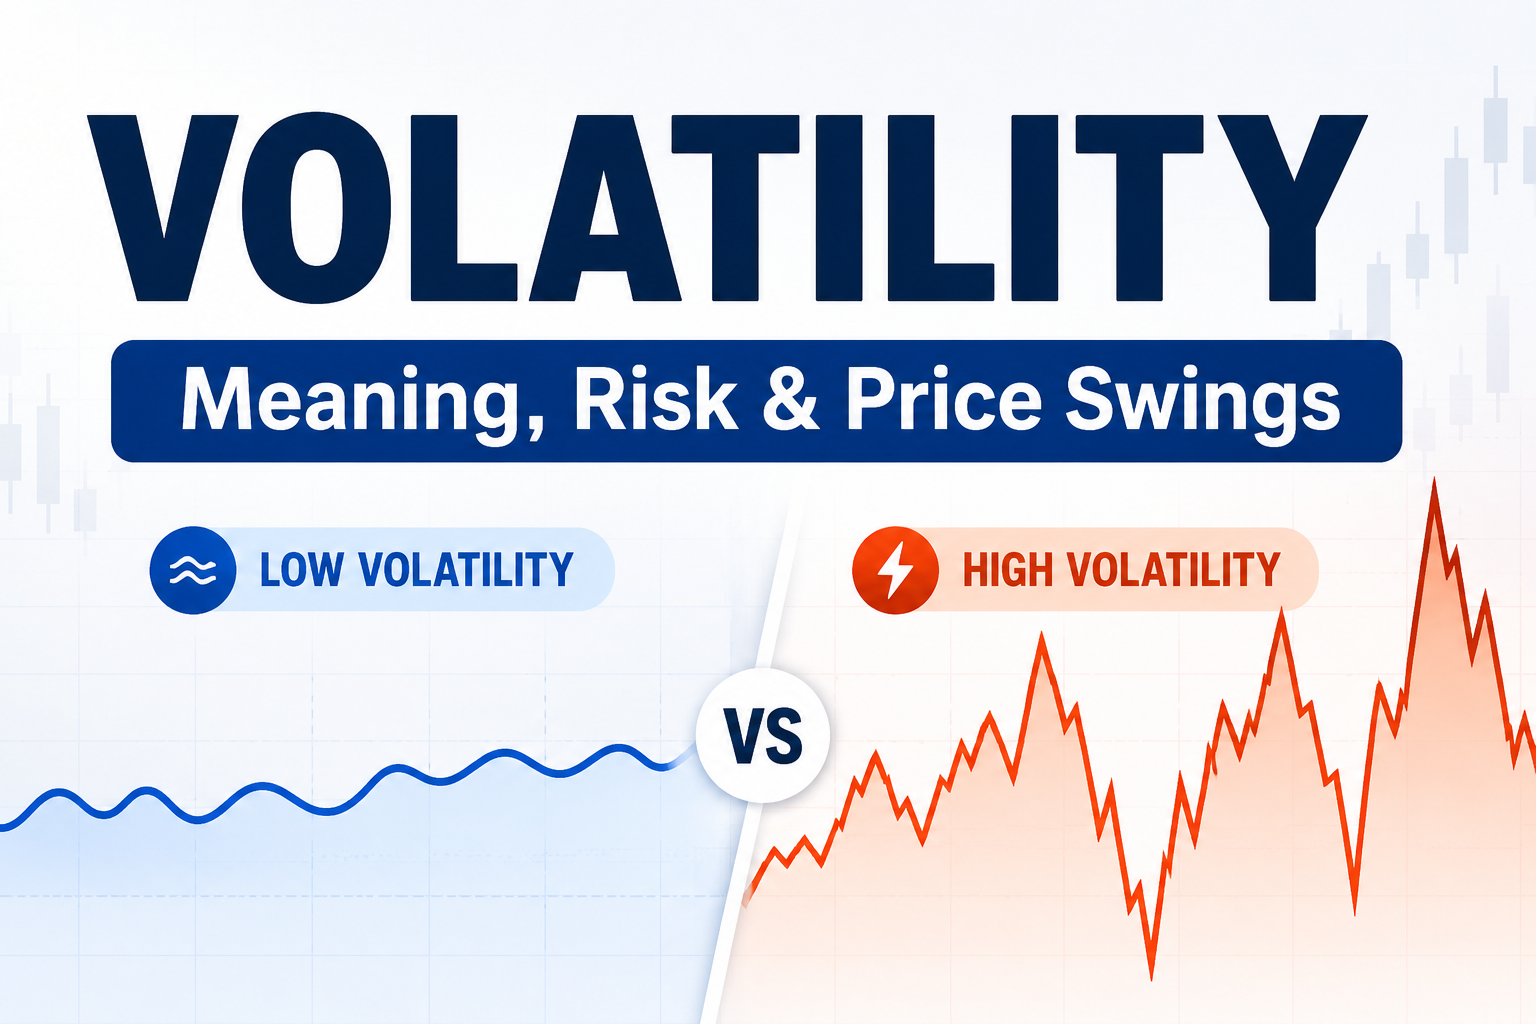
Un valor alto de ATR significa que el mercado opera en rangos de precio más amplios; un ATR bajo indica un mercado tranquilo. Por ejemplo, si el EUR USD tiene un ATR diario de 70 pips, su movimiento promedio diario es de unos 70 pips. Si desciende hasta 35 pips, el mercado se ha vuelto mucho más estable.
Es fundamental recordar que el ATR no detecta tendencia. Un activo puede caer fuertemente o subir con fuerza y mostrar un ATR creciente; solo refleja la amplitud de los movimientos recientes.
| Lectura del ATR | Estado del mercado | Significado operativo |
|---|---|---|
| ATR en subida | Volatilidad en expansión | Se necesita mayor margen en stops; las rupturas suelen tener más fuerza |
| ATR en bajada | Volatilidad en contracción | Predominan los rangos laterales; aumentan las rupturas falsas |
| ATR elevado tras noticias | Reajuste de precios por eventos | Reducir apalancamiento y vigilar riesgos de ensanchamiento de diferenciales y deslizamiento |
| ATR bajo antes de datos económicos | Fase de compresión | Prepararse para una posible expansión de rangos tras el anuncio económico |
Esta utilidad cobra relevancia en 2026. ya que la volatilidad ya no se limita a una sola clase de activos. Las perspectivas del FMI de abril de 2026 advierten nuevas perturbaciones por conflictos en Oriente Medio, subida de precios de materias primas, expectativas inflacionarias firmes y condiciones financieras más restrictivas. El ATR permite cuantificar gráficamente cómo estos impactos macroeconómicos se convierten en rangos operativos.
Fórmula del Rango Verdadero y el ATR
El cálculo del ATR comienza con el Rango Verdadero (TR), que se obtiene del mayor valor entre estas tres mediciones:
Máximo actual menos mínimo actual
Máximo actual menos cierre anterior
Cierre anterior menos mínimo actual
Se elige el valor más alto de los tres como el rango verdadero del periodo.
Esto es esencial porque los mercados pueden presentar huecos de precio. Un rango simple entre máximo y mínimo no refleja todo el movimiento si la apertura está muy alejada del cierre previo; el rango verdadero integra estos saltos para medir la volatilidad de forma más precisa.
Fórmula del ATR:
ATR = Promedio del Rango Verdadero durante n periodos
La mayoría de plataformas usan por defecto 14 periodos. Algunas aplican el suavizado original de Wilder y otras usan media móvil simple; la diferencia es mínima para decisiones generales, pero se recomienda mantener la misma configuración al probar estrategias.
| Componente de la fórmula | Significado |
|---|---|
| Máximo - Mínimo | Rango completo de la vela actual |
| Máximo - Cierre anterior | Detecta huecos alcistas o reajustes rápidos al alza |
| Cierre anterior - Mínimo | Detecta huecos bajistas o reajustes rápidos a la baja |
| n periodos | Generalmente 14, ajustable según temporalidad y estrategia |
Un valor corto del ATR, como 7 períodos, reacciona más rápido, pero genera más ruido. Un valor más largo, como 20 o 50 períodos, reacciona más lentamente, pero ofrece una lectura más suave de la volatilidad.
Siempre se debe analizar el ATR en contexto. Un ATR de 100 puntos en un índice no es lo mismo que 100 pips en un par de divisas; un ATR de 60 dólares en oro tiene distinto significado si el metal cotiza cerca de 2000 o 4500 dólares.
Lo mejor es comparar el ATR con la evolución reciente. Si el ATR actual se encuentra cerca de su máximo de los últimos tres meses, el mercado se encuentra en una fase de aumento de la volatilidad. Si el ATR se encuentra cerca de su mínimo de los últimos tres meses, es posible que el mercado se esté consolidando antes de una ruptura.
También ayuda a evitar colocaciones erróneas de stops. Un stop de 15 pips en el EUR USD puede ser adecuado durante la sesión asiática tranquila, pero demasiado ajustado durante la publicación del IPC estadounidense, nóminas no agrícolas o decisiones de bancos centrales. Si el ATR indica que el par se mueve 80 pips al día, un stop de 15 pips quedará dentro del ruido normal del mercado.
Es su función más utilizada. En lugar de elegir un número fijo de pips, se adapta el stop a la volatilidad vigente.
Fórmula práctica:
Distancia del stop loss = ATR × multiplicador
Ejemplo: si el GBP USD tiene un ATR de 20 pips en temporalidad horaria, se puede usar un stop de 2 veces el ATR, es decir 40 pips. Si la volatilidad sube y el ATR pasa a 35 pips, el mismo multiplicador dará un stop de 70 pips.
No significa que los stops amplios sean siempre mejores, sino que deben adaptarse al entorno. Un stop muy ajustado se activa por ruido normal, mientras que uno excesivamente amplio empeora la relación riesgo-beneficio.
El ATR permite controlar el riesgo de forma inteligente. Al subir la volatilidad, la distancia lógica del stop se amplía; si se mantiene el mismo volumen de operación, el riesgo por operación aumenta.
Por ejemplo:
| Plan de riesgo por cuenta | Entorno ATR bajo | Entorno ATR alto |
|---|---|---|
| Saldo de la cuenta | 10.000 USD | 10.000 USD |
| Riesgo por operación | 1% | 1% |
| Riesgo en dólares | 100 USD | 100 USD |
| Distancia del stop | 40 pips | 80 pips |
| Tamaño de posición | Mayor | Menor |
Esta es una de sus mayores ventajas: vincula la volatilidad con la protección del capital. Los traders que ajustan su volumen según el ATR evitan el sobreapalancamiento en mercados rápidos.
Las rupturas son más fiables si van acompañadas de expansión de rangos. Si el precio supera una resistencia mientras el ATR sube, el movimiento cuenta con mayor participación de mercado. Si la ruptura ocurre con el ATR estable o bajista, carece de fuerza y es más propensa a retroceder.
Es muy útil en oro, índices y pares mayores de divisas. Por ejemplo, si el USD JPY rompe una resistencia con expansión de su ATR diario, se trata de una ruptura respaldada por volatilidad; si rompe el nivel pero el ATR sigue comprimido, el movimiento es frágil.
En mayo de 2026. el USD JPY seguía siendo un claro ejemplo de volatilidad, cotizando cerca de 156.63 el día 8 de mayo. A pesar de fortalecerse a corto plazo, el yen mantuvo debilidad en el año anterior, por lo que los stops ajustados a la volatilidad resultan más eficaces que los valores fijos en pips.
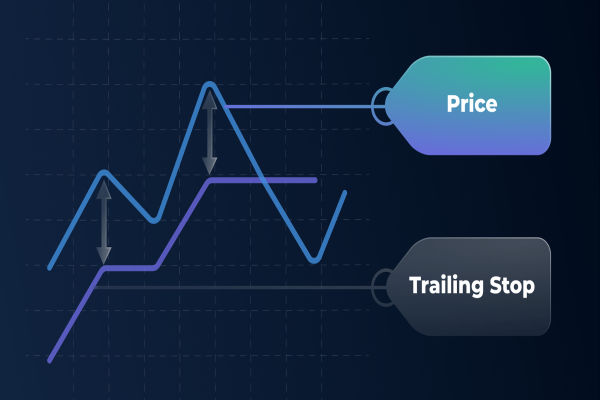
El ATR también sirve para proteger ganancias. Un trailing stop basado en el ATR sigue la evolución del precio y deja margen para retrocesos naturales.
Por ejemplo, un trader de tendencia puede situar el stop de una posición larga 2 veces el valor del ATR por debajo del último máximo local. Si la volatilidad sube, el stop otorga más espacio; si baja, se ajusta de forma más ajustada.
Funciona mejor en mercados con tendencia definida; en rangos laterales irregulares, suele generar cierres prematuros.
Confundirlo con señal de entrada/salida: el ATR solo mide volatilidad, nunca indica dirección. Siempre debe combinarse con análisis de tendencia, soportes y resistencias o indicadores de impulso.
Usar la misma configuración para todas las estrategias: scalpers, traders de tendencia y de posiciones usan temporalidades distintas; un ATR de 14 periodos en gráfico de 5 minutos no equivale al mismo ajuste en diario.
Ignorar diferenciales y deslizamiento: el ATR solo mide rangos de precio, no costes de operación. En noticias importantes se ensanchan los spreads y empeora la ejecución, por lo que un stop teóricamente adecuado puede fallar por falta de liquidez.
Creer que bajo ATR significa bajo riesgo: la baja volatilidad genera falsa seguridad. Muchos movimientos fuertes comienzan tras una fase de compresión del ATR, cuando el mercado acumula fuerza en rangos estrechos.
El ajuste estándar es 14 periodos, ideal como punto de partida. Los ajustes más cortos responden rápido pero generan ruido; los más largos son más estables pero tardan más en reflejar cambios bruscos de volatilidad.
No. Únicamente mide amplitud de movimientos. Una subida del ATR solo confirma mayor fluctuación, sin indicar si el precio subirá o bajará. La dirección se define con tendencia, estructuras o indicadores de impulso.
Sí, especialmente en divisas, ya que su volatilidad varía según sesiones, datos económicos y decisiones de bancos centrales. Permite ajustar stops, volumen de operaciones y expectativas de rupturas.
Totalmente compatible. Las medias móviles definen tendencia, el RSI mide impulso y el ATR valida si la distancia del stop es coherente con el entorno de mercado.
Ni bueno ni malo, solo indica volatilidad elevada. Brinda oportunidades, pero también aumenta el riesgo. Ante valores anómalamente altos, se recomienda reducir volumen o exigir mayor confirmación antes de operar.
El Rango Verdadero Promedio no es una herramienta de predicción, sino un indicador de volatilidad, y esa es su principal utilidad. Convierte los movimientos del mercado en decisiones prácticas: dónde colocar stops, qué volumen usar, si una ruptura tiene fuerza real y cuándo actuar con mayor precaución.
Su mayor valor aparece en escenarios de cambios rápidos de mercado. En entornos tranquilos, evita sobreestimar oportunidades; en entornos volátiles, impide confundir ruido normal con fallos de tendencia. Usado junto con análisis estructural, disciplina y una correcta gestión de riesgo, el ATR sigue siendo una de las herramientas más claras para interpretar el comportamiento del mercado.