What Is Volume Profile?
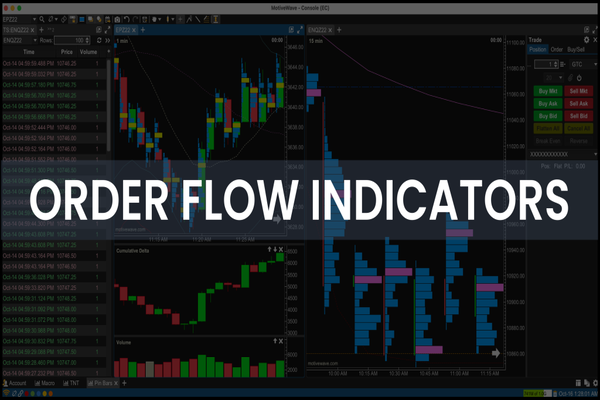
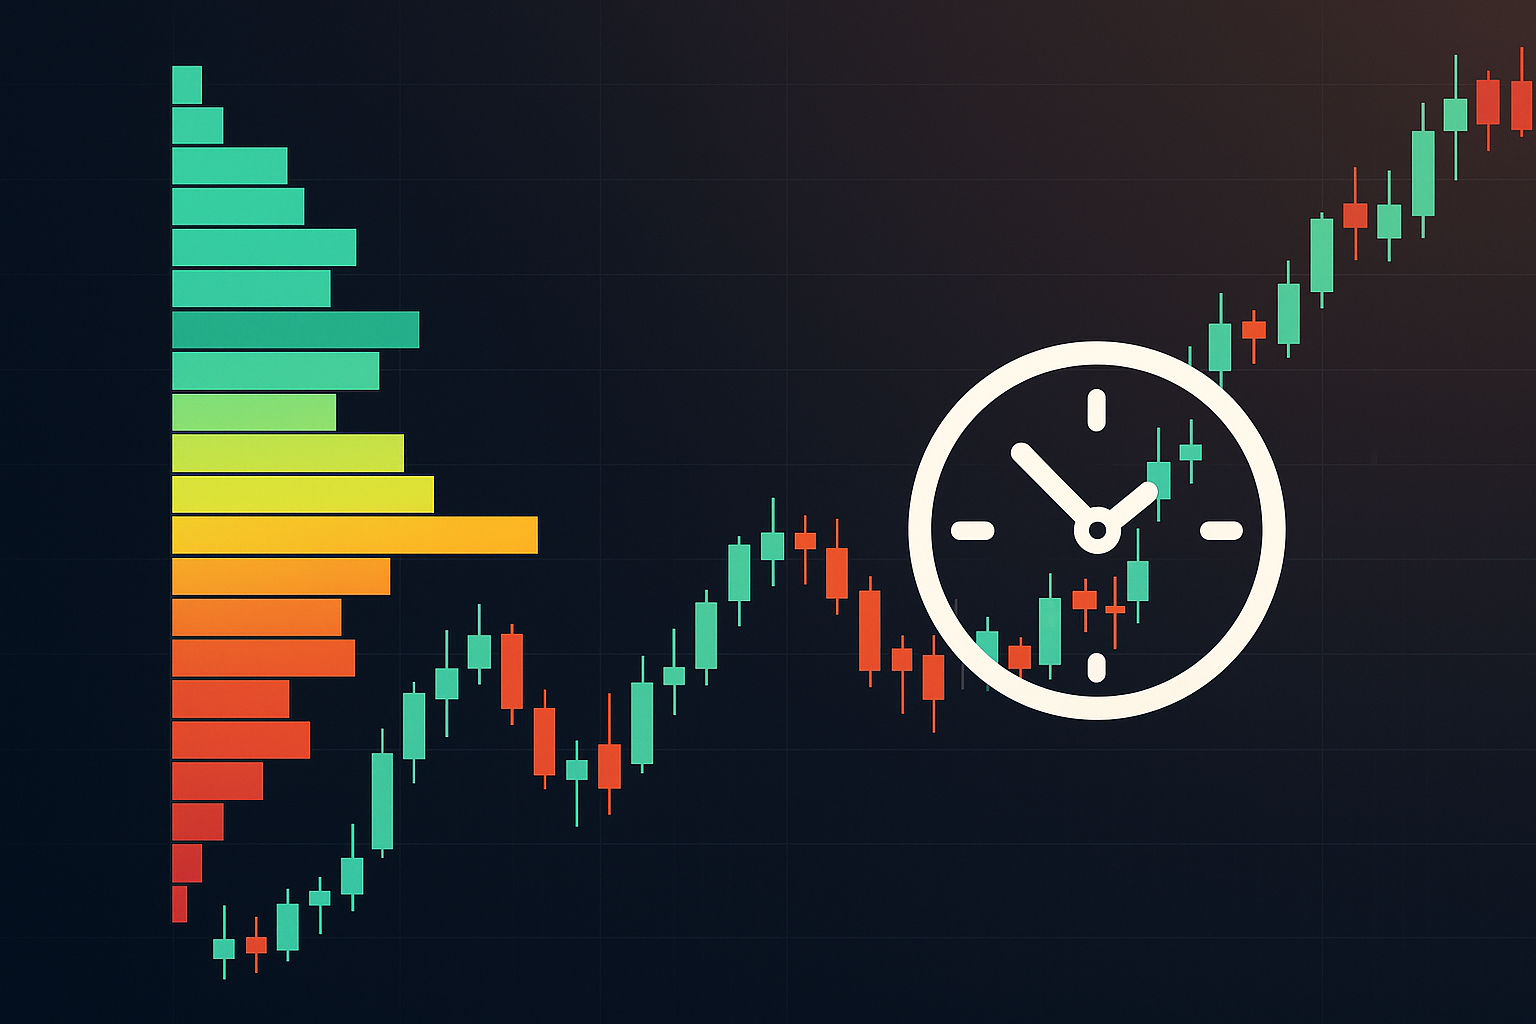
Volume Profile is a charting tool that displays the amount of trading volume executed at each price level during a selected period. Unlike traditional price charts that focus on how price changes over time, Volume Profile presents a horizontal histogram showing where buyers and sellers were most active. This helps reveal true market interest zones, highlighting areas where price has found acceptance or rejection based on actual traded volume.
Why Volume Profile Matters in Trading
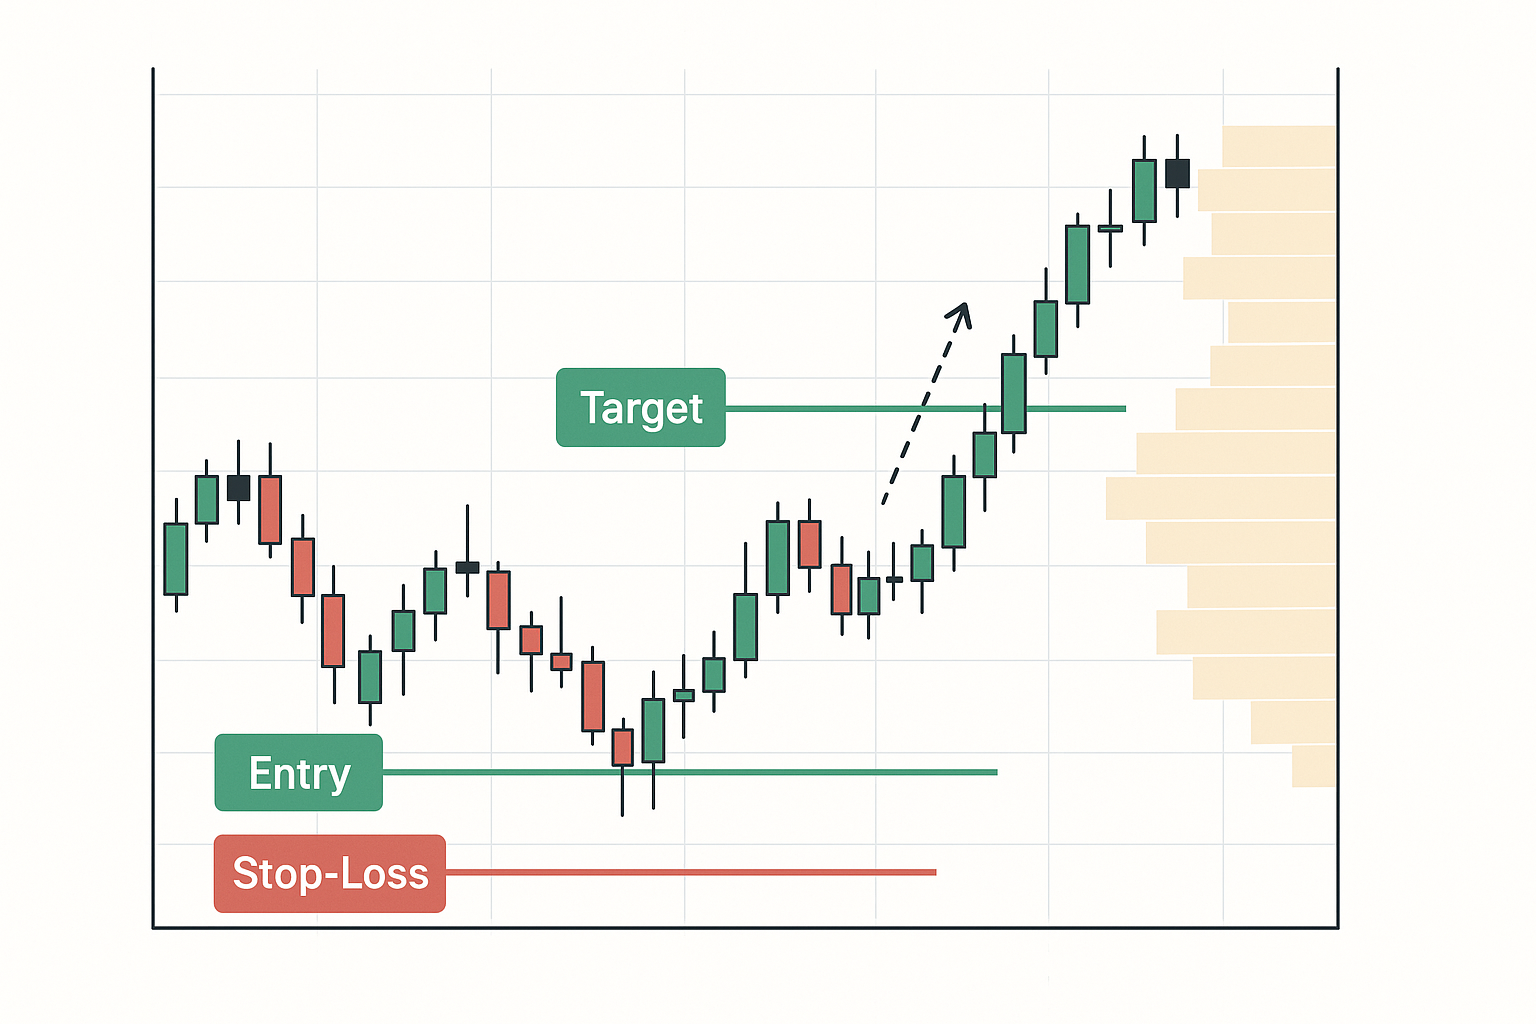
Standard price charts show the path of price but offer limited insight into the strength behind moves. Volume Profile adds crucial context by pinpointing price levels with significant trading activity, known as high volume nodes. These levels often act as support or resistance, where the price may pause or reverse.
Conversely, low-volume nodes are points where the market found little agreement, and price tends to move through these areas quickly. Traders use this information to anticipate price behaviour, enabling better timing of entries and exits, as well as more precise risk placement.
Understanding where most trading has taken place helps clarify market structure and allows traders to plan around real liquidity and acceptance zones, rather than relying purely on price patterns.
Real-World Use of Volume Profile
Consider a $20,000 trading account focusing on a tech stock over the last week. The Volume Profile indicates:
-
A High Volume Node around $150, signalling heavy trading and a likely support zone.
A Low Volume Node near $155, where the price moved swiftly without much resistance.
Today, if the price approaches $155, this low volume suggests a potential swift breakout. A trader might enter at $155.50, placing a stop just below $150 (the high volume support).
Breakdown:
-
Entry price: $155.50
-
Stop-loss: $149.80
-
Risk per share: $5.70
-
Risk per trade (1% account risk): $200
-
Position size: $200 ÷ $5.70 ≈ 35 shares
-
Profit target: $165 (next resistance level)
Potential profit: $9.50 × 35 ≈ $332
Using Volume Profile, the trader bases decisions on factual market activity, improving the odds of success and managing risk precisely.
Common Misunderstandings About Volume Profile
-
Volume Profile is merely another indicator: It is better viewed as a map of market structure based on actual liquidity concentrations.
-
Past volume data is irrelevant: Historical volume levels guide future price reactions because they mark where traders reached consensus.
-
High volumes always provide support: These are zones rather than exact lines, and price can break through after absorption.
Use is restricted to day trading: Volume Profile is effective on all timeframes and useful for swing or position traders as well.
Related Terms
| Term |
Description |
| Support and Resistance |
Price levels where buying or selling pressure tends to slow or reverse movement. |
| Order Book |
Real-time list of buy and sell orders showing current market depth and liquidity. |
| Volume Weighted Average Price (VWAP) |
The average price is weighted by volume, serving as a benchmark and dynamic level. |
| Market Profile |
A tool that categorises volume by price and time segments for detailed mapping. |
Pro Tips for Using Volume Profile

Professional traders integrate Volume Profile within a comprehensive trading strategy:
-
They seek confluences where high-volume nodes align with other technical signals like the 200-day moving average or Fibonacci retracements to strengthen trade setups.
-
Real-time monitoring of order flow near Volume Profile value area boundaries helps decide whether breakouts will hold or fail.
Stops are placed logically beyond heavy volume zones to avoid early exits due to normal market noise.
Volume Profile is not a standalone solution but a powerful framework that, combined with other tools, improves market timing and decision quality.
Conclusion
By illuminating where real trading occurs, Volume Profile transforms price charts into detailed maps of market liquidity—equipping traders with a valuable edge in timing entries and exits while managing risk confidently.


