Definition
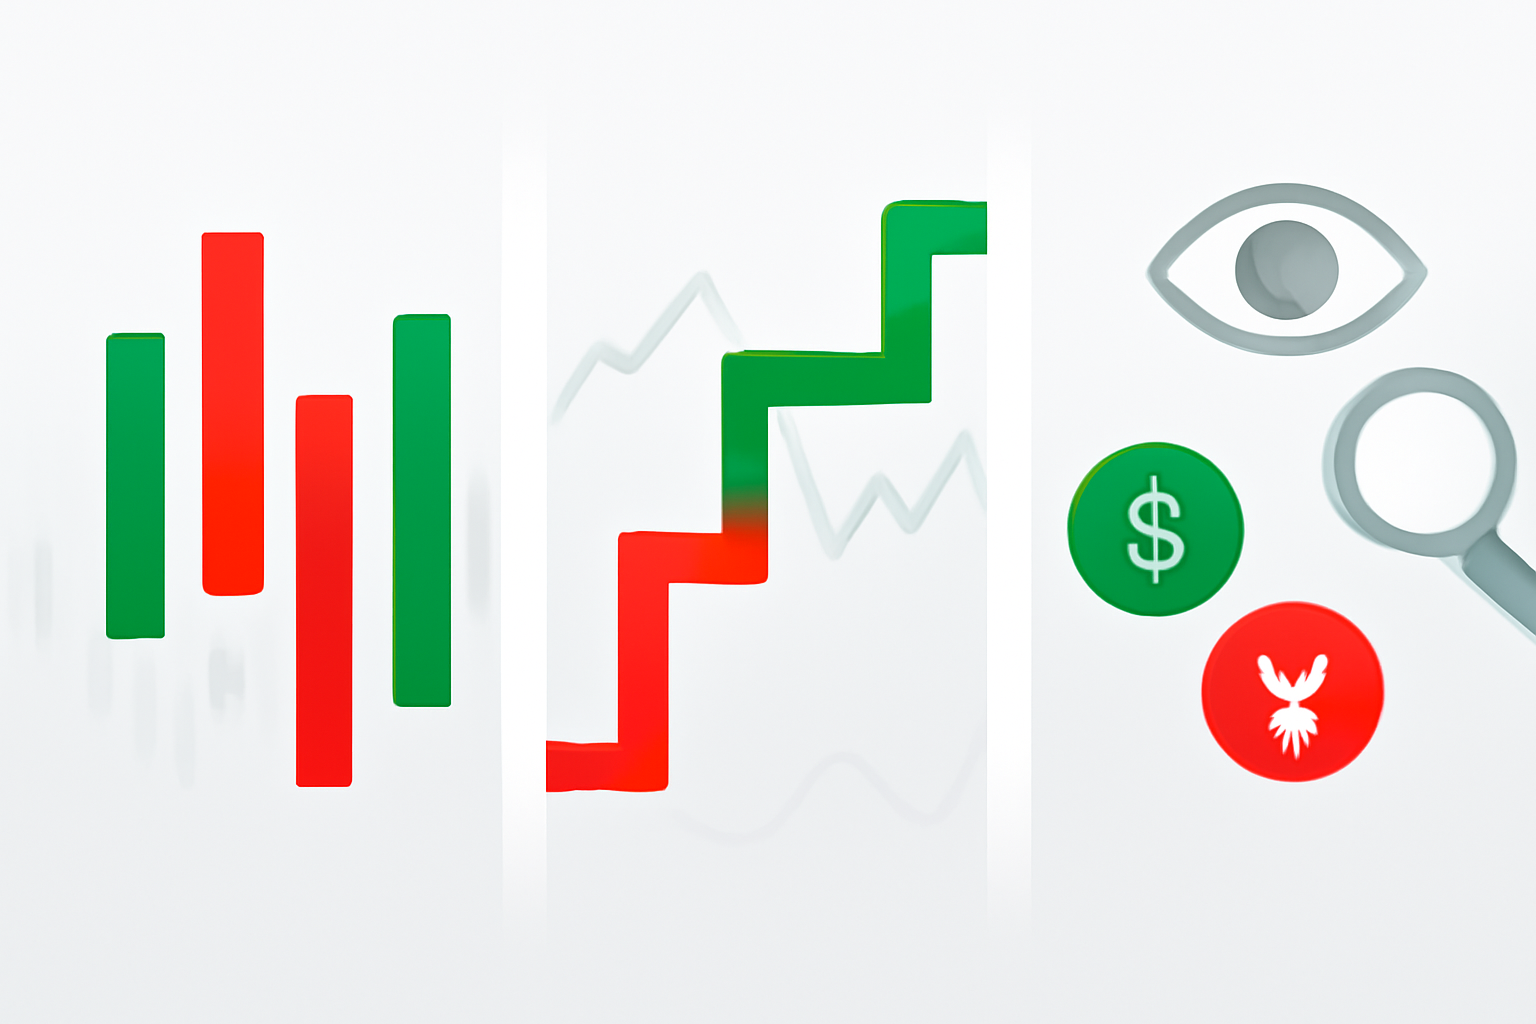
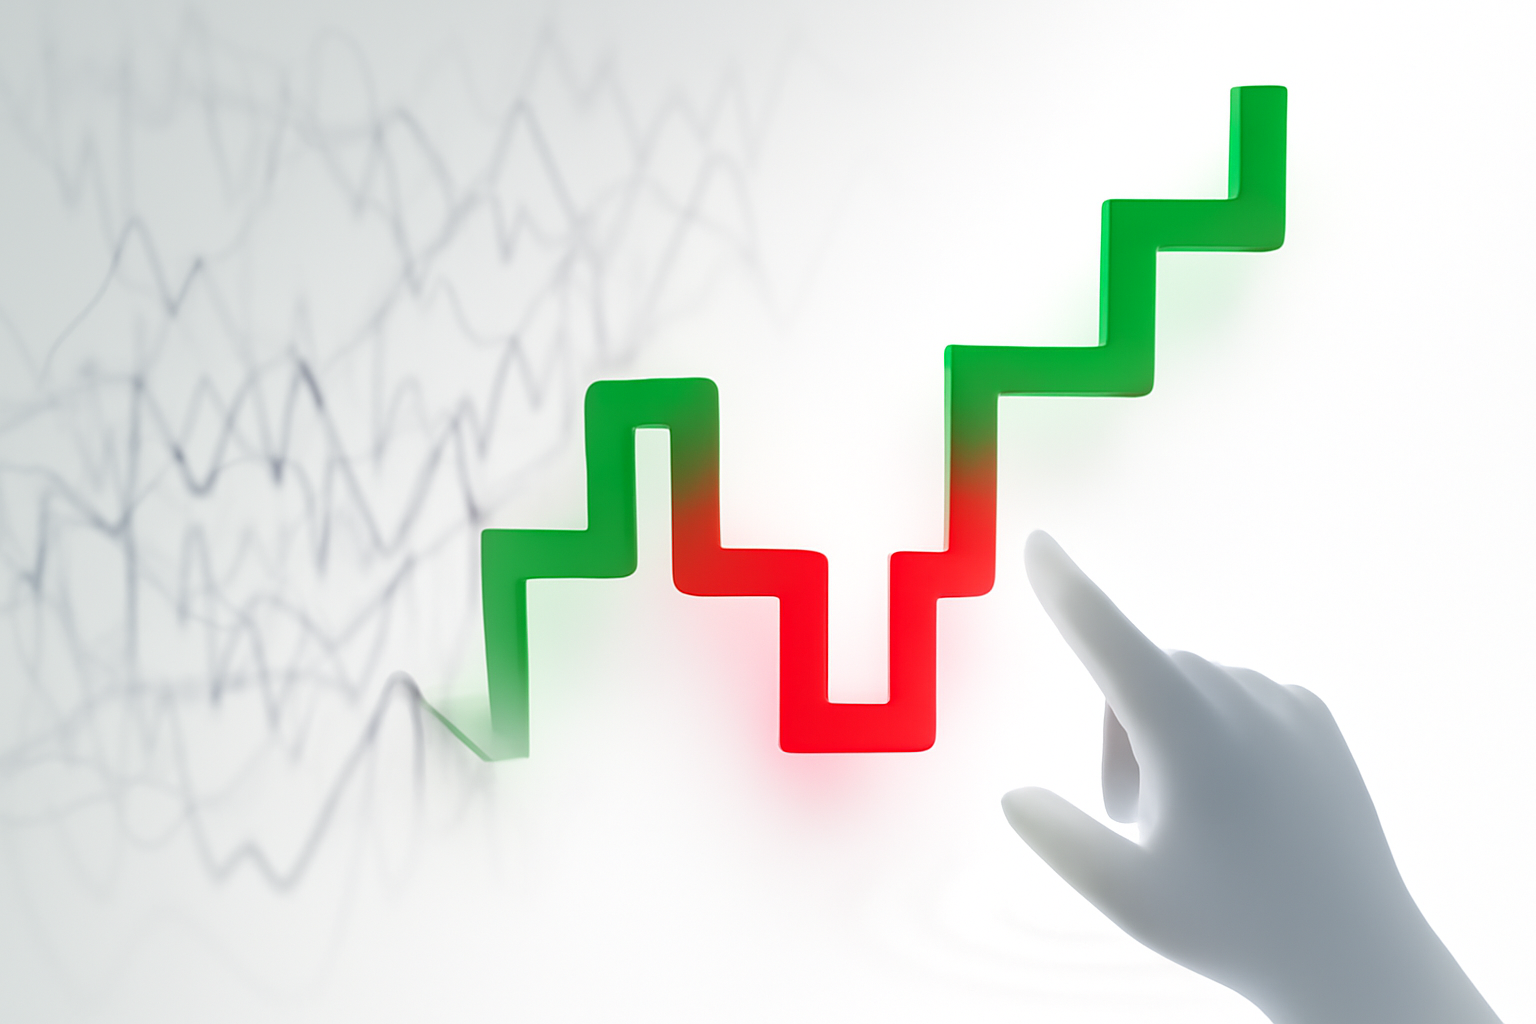
A Kagi chart is a type of price chart used in technical analysis that emphasises price movements and trends rather than time. Unlike traditional charts that plot price at fixed intervals (daily, hourly), Kagi charts focus solely on price changes, drawing vertical lines that switch direction only when prices reverse by a set amount. This method filters out minor price fluctuations or “noise,” presenting a clearer picture of supply and demand dynamics.
The lines in a Kagi chart change thickness or colour depending on price action — typically, a thicker or differently coloured line signals bullish momentum (rising prices), while a thinner or contrasting line signals bearish momentum (falling prices).
Why It Matters
Kagi charts help traders identify key support and resistance levels, spotting buying and selling pressure without the distraction of time-based noise. This clarity can improve the timing of entries and exits, making them valuable for trend-following strategies.
Because Kagi charts are based purely on price action, they adapt better to volatile or sideways markets, reducing false signals common in traditional candlestick or bar charts. They are used across various markets, including stocks, forex, and commodities, making them versatile tools for traders at any level.
Choosing the Right Reversal Amount
The reversal amount is key to how a Kagi chart is constructed—it represents the minimum price change required before the chart reverses direction. Choosing this value effectively is crucial:
-
Fixed Amount: A set dollar or cent amount (e.g., $2) makes the chart simple but can be too sensitive in low volatility or too sluggish in high volatility markets.
-
Dynamic Amount: Using a percentage of price (e.g., 1-2%) or a volatility measure like the Average True Range (ATR) helps the chart adapt automatically to changing price behaviours.
Practical Tip: Beginners can start by setting the reversal amount to roughly 1-2% of the asset price or by calculating the average daily price movement to filter minor noise while capturing meaningful trends.
Practical Example
Imagine you are trading shares of a US tech company priced around $150. Using a Kagi chart with a reversal amount of $3, the chart will draw vertical lines that continue upward or downward until the price reverses by $3.
-
If the price rises from $150 to $160 without moving lower than $157, the Kagi line continues up, thickening as it breaks the previous high at $155, signalling bullish momentum.
If the price then drops to $157 or lower, the Kagi line switches direction downward, becoming thinner, alerting traders to potentially weakening buying pressure.
This makes it easier to spot key trend shifts than if watching raw price data that fluctuates every minute.
Comparing Kagi to Other Chart Types
CHART TYPE
|
FOCUS |
TIME COMPONENT |
PRIMARY USE |
Kagi Chart |
Price reversals, trends |
No |
Clear trend/reversal identification |
| Candlestick |
Price, time, volume
|
Yes |
Short-term, intraday analysis
|
| Renko Chart |
Price movements "bricks" |
No |
Trend-following, noise filtering |
Point & Figure
|
Price direction & extent |
No |
Breakouts, support and resistance
|
Unlike candlestick charts, Kagi ignores time intervals, focusing solely on price action magnitude, which reduces noise and avoids misleading signals caused by time-based fluctuations.
How Kagi Charts Generate Signals
-
Line Thickness/Colour: The line becomes thicker or changes colour (e.g., from red to green) when price breaks a previous high or low, signalling bullish or bearish momentum shifts.
-
Support and Resistance: Horizontal shifts in the Kagi chart often correspond to support/resistance levels, helping traders identify crucial price zones.
-
Reversals: When the price reverses by the set amount, the chart changes direction—this switch often signals a potential trend change.
Double Top/Bottom Patterns: Repeated tests of highs or lows in the chart can warn of trend exhaustion or possible reversals.
Using Kagi Charts for Different Markets
-
Stocks: Use daily closing prices with reversal amounts set relative to stock volatility, typically 1–3% of price.
-
Forex: Adjust the reversal amount in pips or as a percentage of average daily movement, mindful of currency pair volatility.
-
Commodities: Given higher volatility, larger reversal amounts are often necessary (e.g., a few percentage points or more per move).
Cryptocurrencies: Due to extreme volatility, dynamic reversal amounts based on ATR or percentage are essential.
Limitations of Kagi Charts
-
Lack of Timing Information: Since no time scale is applied, precise timing for entry or exit is less apparent than on time-based charts.
-
No Volume Data: Kagi charts exclude volume, which is a valuable signal for many traders.
-
Lag in Reversals: Like other trend-following indicators, Kagi charts confirm reversals only after price has moved significantly.
Unsuitable for High-Frequency Trading: Intraday traders needing minute-by-minute analysis may find Kagi less responsive.
Real-World Example with Numbers
Suppose you are tracking a stock priced at $100 with a reversal amount of $3:
-
Stock rises steadily from $100 to $105; since the price never reverses by $3 downward, the Kagi line continues upwards.
-
At $105, the stock falls to $103 (a $2 drop) — no reversal yet (below $3 threshold).
-
It then falls to $102 (a total $3 drop from $105) — the Kagi chart reverses direction, changing the line from thick/green (bullish) to thin/red (bearish).
If the price rises again by $3 or more, the line switches back to bullish.
This behaviour helps you focus on meaningful trends without reacting to every small price change.
Common Misconceptions or Mistakes
-
Kagi charts show time trends: Unlike candlestick or bar charts, Kagi charts do not plot price by time intervals; ignoring this can confuse beginners expecting time labels on every move.
-
Suitable for all trading styles: Kagi charts are best suited for trend-following and swing trading, less effective for very short-term scalping, where intraday timing is critical.
-
Ignore volume or other indicators: Kagi charts focus on price action alone—they don't show volume or momentum directly, so combining with other tools is advised.
Fixed reversal amount problem: Setting the reversal amount too small can lead to noisy charts; too large can miss important reversals. Finding the right balance is key and may require trial and error.
Related Terms
-
Renko Chart: Another price-based chart that filters out time, using fixed “bricks” to show price moves.
-
Point and Figure Chart: Similar to ignoring time and focusing only on price direction and magnitude, used for spotting support and resistance.
-
Support and Resistance: Price levels at which buying or selling pressure historically prevents further moves, which Kagi charts help highlight.
Trend Following: A trading strategy that seeks to profit by identifying and riding sustained price movements, where Kagi charts are especially helpful.
Pro Takeaway

Professional traders appreciate Kagi charts for their ability to reduce market noise and provide clear visual cues of trend strength and reversals. They often:
-
Use adaptive reversal amounts based on volatility or average true range (ATR) to keep charts relevant through changing market conditions.
-
Combine Kagi charts with volume indicators, moving averages, or oscillators to confirm trade signals or improve risk management.
-
Employ Kagi charts in multi-timeframe analysis, overlaying them on daily, weekly, or monthly periods to spot longer-term trends.
Integrate Kagi signals into algorithmic trading or systematic strategies because of their clear, rule-based formation of trends and reversals.
In Conclusion
Kagi charts give traders a powerful tool to visually filter out minor price fluctuations, focus on the essence of market supply and demand, and refine trading decisions with less distraction.


