Definition
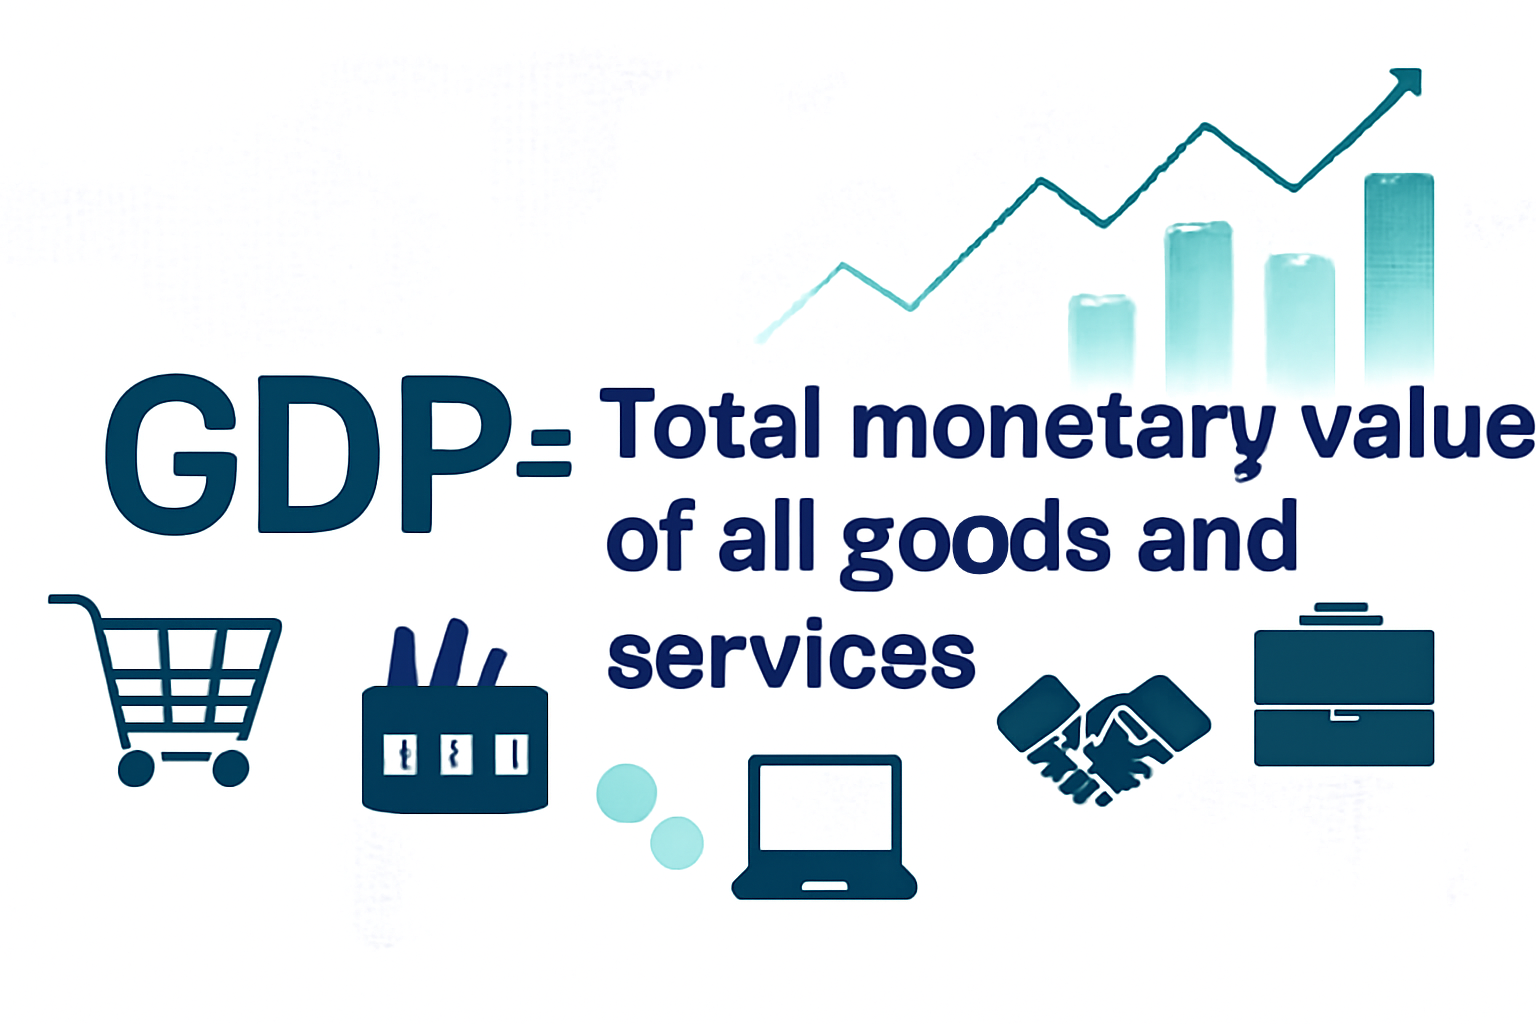
GDP (Gross Domestic Product) measures the total monetary value of all goods and services produced within a country's borders over a set period—usually quarterly or annually. Expressed in US dollars for easy global comparison, GDP provides a broad snapshot of economic activity and health. Economists, governments, and investors use it to assess size, growth, and performance of national economies.
Why It Matters
GDP is one of the most important economic indicators, widely monitored because it drives capital markets and influences policy decisions:
-
Market Indicator: Strong GDP growth suggests higher corporate earnings, job creation, and consumer spending, often boosting stock markets.
-
Risk Signal: Slow or negative GDP growth can indicate recessions or economic troubles, leading to risk-off sentiment and market declines.
-
Central Bank Decisions: Central banks closely watch GDP data to decide on interest rates, stimulus, or tightening policies, which heavily influence bond and forex markets.
Investor Confidence: Reliable GDP growth boosts confidence, encouraging higher investment and economic expansion.
Practical Example
Suppose the US reports a GDP of $28 trillion in 2025, up 2.5% from $27.3 trillion in 2024. Traders interpret this as healthy economic momentum, which may:
-
Boost US stock market indices as companies see rising demand and profits.
-
Strengthen the US dollar versus other currencies due to improved economic prospects.
Influence bond yields and central bank policy expectations, affecting fixed income markets.
Conversely, if GDP contracts or misses expectations, it might trigger market caution and selling pressure.
Common Misconceptions or Mistakes
-
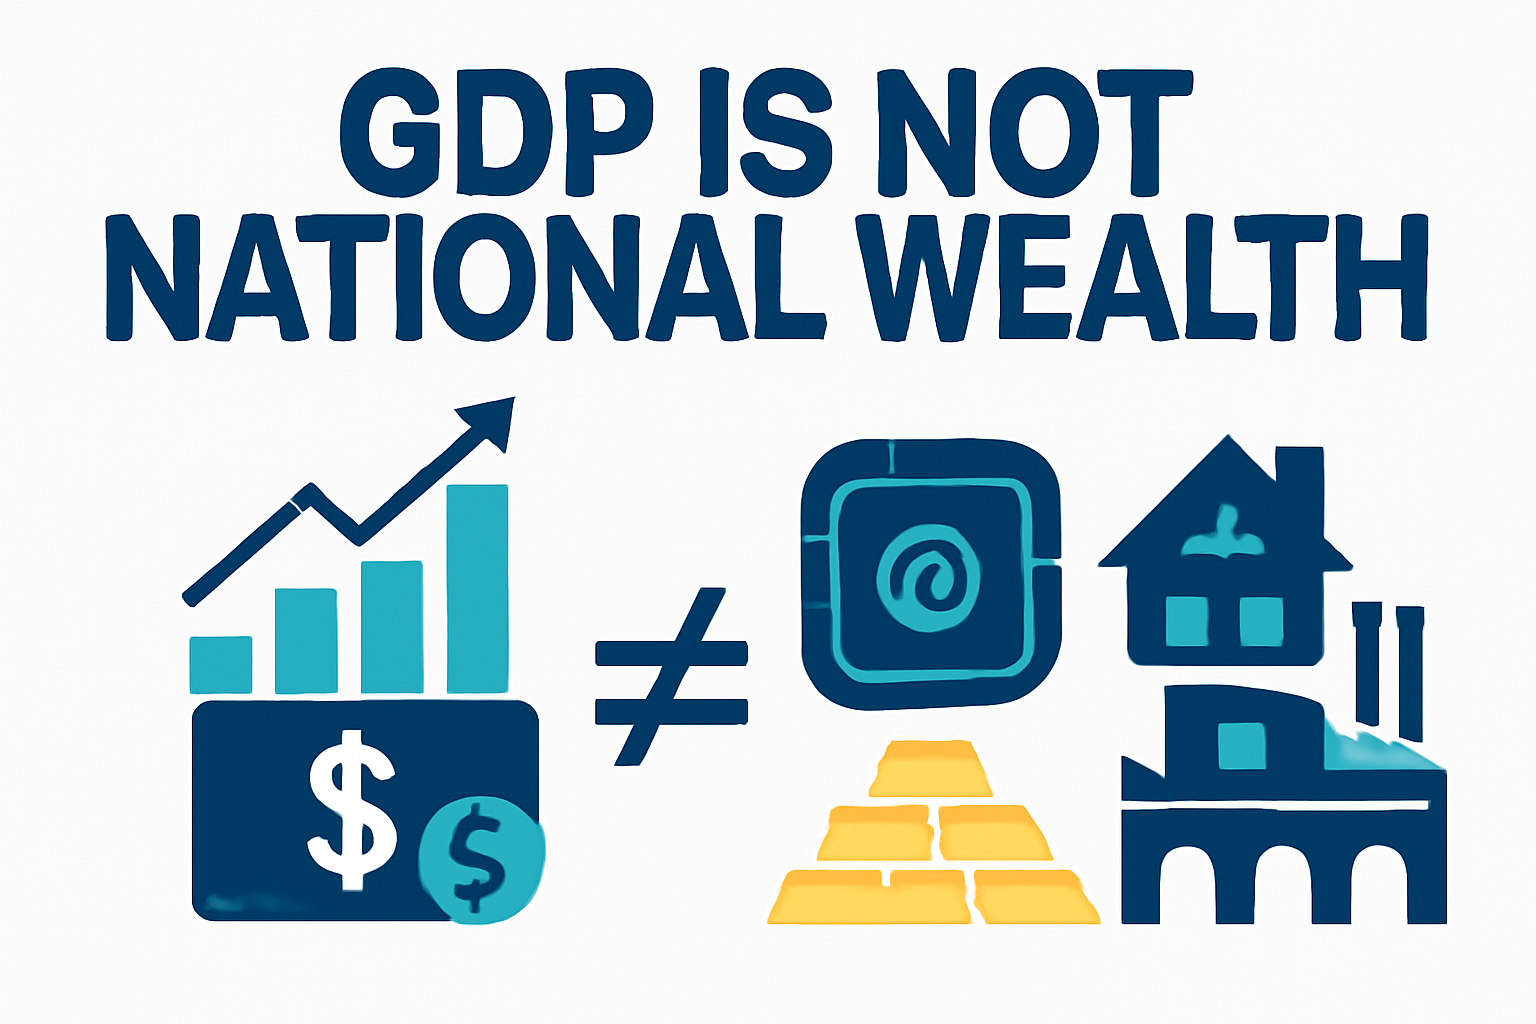
GDP Equals National Wealth: GDP measures current production, not wealth or income distribution. A country can have a high GDP but poor living standards or inequality.
-
Bigger GDP Means Better Life: GDP per capita is a better measure of average prosperity than total GDP, as it accounts for population size.
-
Ignoring Inflation: Nominal GDP (not inflation-adjusted) can be misleading over time. Real GDP removes inflation's effects to reflect true growth.
All Economic Activity Measured: GDP excludes informal sectors, household production, and black-market transactions, potentially underestimating real economic activity.
Related Terms
-
GDP per capita: Average economic output or income per person, calculated by dividing GDP by population.
-
Real GDP: Inflation-adjusted GDP, showing genuine growth in output, filtering out price changes.
-
Nominal GDP: GDP valued at current prices, useful for snapshots but not long-term comparisons.
Gross National Product (GNP): Economic output by a country's citizens, regardless of borders, unlike GDP which measures domestic activity.
Components of GDP
GDP consists of four main components that provide insights into economic drivers:
-
Consumption: Spending by households on goods and services—the largest component in most economies.
-
Investment: Business spending on capital like factories and equipment, plus residential construction.
-
Government Spending: Public sector expenditure on services, infrastructure, and defence.
Net Exports: Exports minus imports, reflecting trade balance.
Analysing these can reveal which sectors fuel growth or cause slowdowns.
How GDP Data Is Reported and Revised
GDP figures are released quarterly and come in three estimates:
-
Advance estimate: First, often based on partial data and subject to revision.
Second and third estimates: Incorporate more complete data, often revising earlier numbers.
Market reactions can be volatile, especially after surprises or large revisions.
GDP and Business Cycles
GDP growth rates help identify phases of the business cycle:
-
Expansion: Rising GDP with a strengthening economy.
-
Peak: Highest point before slowing.
-
Contraction/Recession: Negative growth period.
Trough: Bottom before recovery begins.
Understanding cycle phases helps traders anticipate market turns.
Pro Takeaway
-
GDP Surprises Move Markets: Professionals track GDP releases closely and compare them to forecasts. Positive surprises often buoy the local currency and equities, while disappointments can cause selloffs.
-
Sector Sensitivity: Traders dissect GDP components to spot strong or weak sectors, aiding in sector rotation and selective stock picking.
-
Global Comparisons: Comparing GDP trends across countries aids currency and international equity trading by highlighting faster-growing economies.
-
Policy Forecaster: Skilled traders anticipate central bank moves based on GDP outlooks, positioning ahead of rate changes or stimulus announcements.
Economic Models & Forecasting: Advanced pros use econometric models incorporating GDP data for scenario analysis and risk management, enhancing strategy robustness.
Conclusion
GDP opens a window into the true state of an economy and guides informed decisions in trading, investing, and policymaking.


