What Is Williams %R?
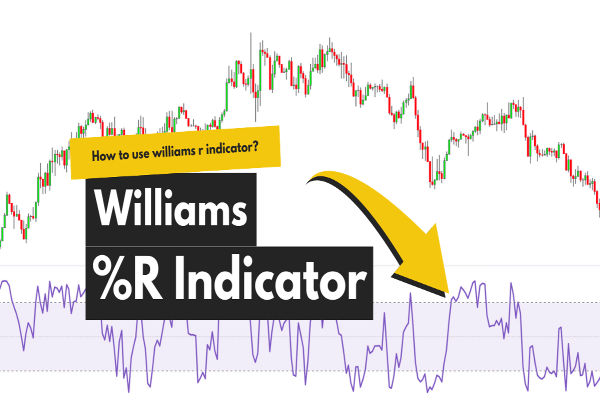
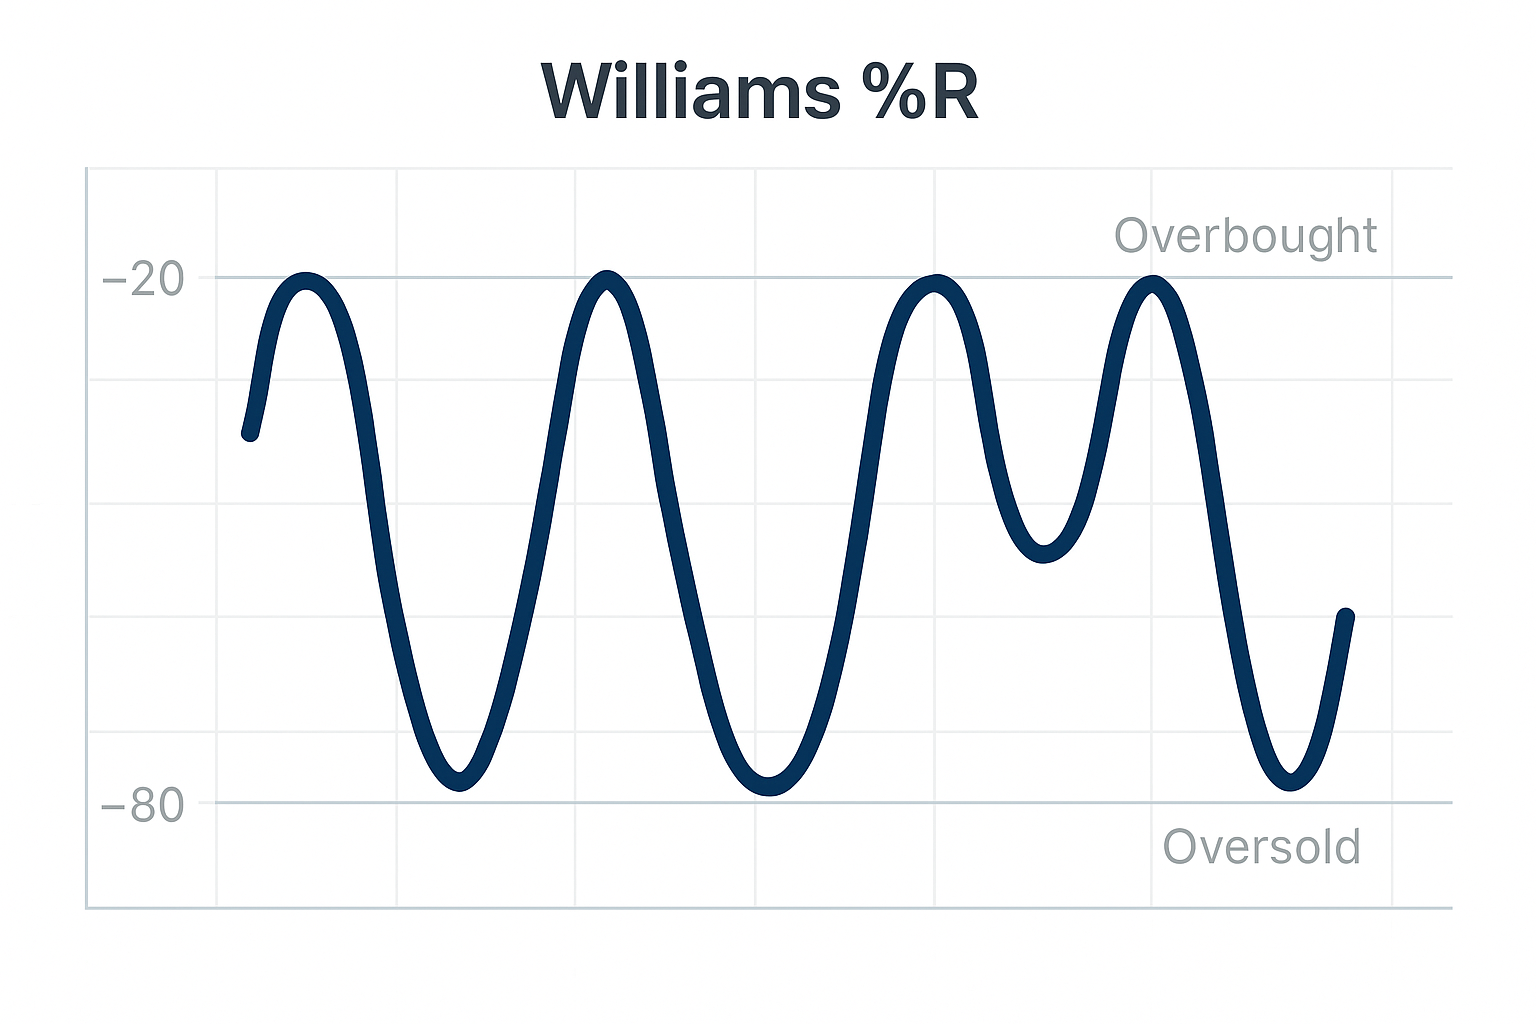
Williams %R, pronounced “Williams Percent Range,” is a momentum oscillator developed by trader Larry Williams. It measures where the current closing price sits relative to the highest high and lowest low over a recent look-back period, commonly 14 days. The indicator generates values between 0 and -100, with values near 0 indicating price is near the recent high and values near -100 indicating it is near the recent low.
Unlike many oscillators, the scale is inverted: a reading of -10 means the price is very close to its highest recent level, while -90 suggests the price is close to its lowest recent level. This “percent range” reflects how far the price is down from the recent high, expressed as a percentage.
Basically, Williams %R tells traders if an asset is potentially "overbought" (trading near the upper extreme of its recent range) or "oversold" (near the lower extreme), which may suggest a reversal or pause in the prevailing price trend.
Why Williams %R Matters in Trading
Williams %R is valuable because momentum often precedes price. When an asset becomes overbought, it means buyers may be exhausted, increasing the chance of a pullback. Conversely, oversold conditions hint that selling pressure might be overdone, raising the likelihood of a bounce.
Using overbought and oversold zones as signals helps traders avoid costly errors, such as entering long positions near short-term peaks or selling too early near bottom levels. Williams %R is suitable for various market types and timeframes, enhancing tactical decisions in both trending and sideways markets.
However, it's important to understand that overbought does not guarantee an immediate reversal. Strong trends can remain overbought for days or weeks, so confirmation with volume indicators, price action, or supporting tools is crucial. The indicator's real power lies in highlighting conditions that warrant closer attention or trigger careful trade management.
Applying Williams %R in Real Trades
Envision a $15,000 trading account targeting a volatile technology stock. The stock price surged quickly over two weeks, pushing Williams %R to -15, signalling overbought conditions.
-
Knowing this, a trader might choose to delay opening a new long position to avoid entering near a peak.
If already holding the stock, the trader could tighten the stop-loss to lock profits or use a trailing stop as the price moves higher.
A few days later, after a pullback, Williams %R drops to -85, indicating oversold conditions. The trader buys 100 shares at $75 per share.
-
To limit downside risk, a stop-loss is set $5 below at $70.
If price rebounds to around $85, that's a $10 gain per share, translating to a total profit of $1,000 (100 shares × $10).
In this scenario, Williams %R helped avoid entering at a vulnerable peak and suggested an opportune time to buy near a price floor, effectively improving trade timing and risk control.
Common Pitfalls with Williams %R
-
Believing it predicts perfect tops or bottoms: Williams %R identifies probability zones rather than certainties. Reversals occur based on broader market context, not indicator readings alone.
-
Acting solely on overbought/oversold levels: Markets often remain overbought or oversold during strong trends. Waiting for additional confirmation, such as candlestick patterns or volume increases, reduces false signals.
-
Ignoring divergence signals: Sometimes price reaches new highs or lows, but Williams %R does not follow suit. This divergence often signals weakening momentum and impending reversals.
-
Using Williams %R in isolation: It works best alongside trend indicators (like moving averages), volume analysis, or other oscillators for a well-rounded trading approach.
Misapplying thresholds: Different assets or timeframes may require adjusted overbought (-20 or -10) and oversold (-80 or -90) levels. Traders should backtest and customise these settings for their particular market.
Related Terms
-
Relative Strength Index (RSI): An oscillator measuring the speed and change of price movements on a scale from 0 to 100. RSI and Williams %R often produce similar signals but differ in calculation and scale.
-
Stochastic Oscillator: Compares a stock's closing price to its price range over a look-back period. Like Williams %R, it identifies momentum shifts and overbought/oversold conditions.
-
Momentum Indicator: A category of technical tools measuring the rate of price change to detect strength or weakness within a trend.
Support and Resistance: Horizontal zones on charts where price action historically stalls or reverses, often used with oscillators like Williams %R to find entry and exit points.
Advanced Uses of Williams %R
Professional traders integrate Williams %R into sophisticated trading systems:
-
Watching for divergence between price and the indicator helps identify weakening momentum before price reversal, offering early exit or entry signals.
-
Using multi-timeframe analysis, combining daily and weekly Williams %R signals to validate trends and reduce false alarms.
-
Pairing Williams %R with volume analysis and trend filters to avoid misleading signals during market noise or consolidation phases.
-
Adjusting the overbought and oversold thresholds for different assets or market conditions—for example, tightening thresholds in volatile crypto markets or loosening them in slow-moving blue-chip stocks.
Applying Williams %R within rule-based entry and exit strategies ensures consistent and disciplined trading, preventing emotional decisions.
Williams %R is a practical, easy-to-read momentum tool that highlights potential price extremes. When combined with additional confirmation and sound risk management, it helps traders enter and exit markets with improved timing and confidence, reducing unnecessary losses and maximising profit opportunities.


