Published on: 2025-07-09
Updated on: 2025-07-09
The pin bar candlestick is one of the most widely recognised signals in price action trading. It indicates a potential reversal in market direction, helping traders anticipate turning points with a relatively high degree of precision. Common in forex, commodities, and stock markets, the pin bar candlestick pattern is known for its simplicity and visual clarity.
The term “pin bar” comes from “Pinocchio bar,” a name originally coined to describe how the pattern reveals market deception. Much like the fairy tale character's nose growing when he lies, the extended wick of a pin bar shows where the market tried to move in one direction before rejecting it completely. This rejection is what makes the pin bar candlestick a valuable signal for price reversals.

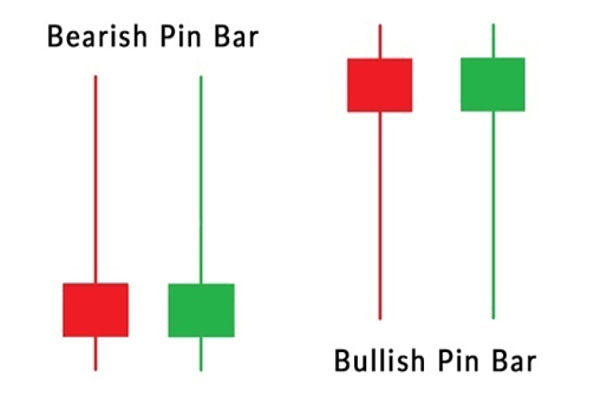
A pin bar candlestick is defined by a small body and a long wick, or shadow, which protrudes significantly from one end. The long wick shows that price was rejected strongly in that direction during the trading session. The shorter the body and the longer the wick, the more reliable the signal tends to be.
There are two types of pin bar candlesticks: bullish and bearish. A bullish pin bar has a long lower wick and suggests that the market rejected lower prices, indicating potential upward movement. A bearish pin bar has a long upper wick and implies rejection of higher prices, suggesting a likely move downward.
For a pin bar candlestick to be valid, it typically appears after a clear trend or at key support and resistance zones. It should not be surrounded by indecision or choppy price movement. Traders often use additional confirmation tools such as volume analysis, trendlines, or moving averages to support the signal generated by the pin bar candlestick.
The pin bar candlestick works because it reflects real-time sentiment shifts in the market. If buyers or sellers attempt to push price aggressively in one direction and fail, the reversal of that move often signals exhaustion. This shift in momentum is clearly visualised through the pin bar's structure.
In practical trading, the pin bar candlestick is not used in isolation. Traders observe the context in which the pin bar forms. For example, a bullish pin bar candlestick near a support level carries more weight than the same pattern in the middle of a consolidation zone. Likewise, a bearish pin bar candlestick that forms at resistance after a sustained uptrend may be a strong signal of reversal.
The pattern's reliability depends on market conditions. Trending environments tend to produce more reliable pin bar signals compared to ranging markets. Nonetheless, the pin bar candlestick is popular among both beginners and seasoned traders due to its visual simplicity and ease of identification.

In forex markets, the pin bar candlestick is often used to trade major currency pairs around economic announcements or technical levels. For example, a bullish pin bar candlestick that appears after a sudden decline in the EUR/USD pair may suggest a rejection of the lower price and a return to higher levels. Traders often set stop-loss orders just below the wick of the pin bar for protection.
In commodities like gold or oil, the pin bar candlestick can act as an early warning signal of a change in investor sentiment. Gold traders, in particular, use this pattern in conjunction with support zones and inflation-related news events to identify strategic entry points. A well-formed pin bar candlestick on a daily chart in these markets can signal a swing in sentiment that lasts for several days or even weeks.
The adaptability of the pin bar candlestick across asset classes makes it a core element in many trading strategies, particularly those focused on momentum and reversals.
While the pin bar candlestick pattern is popular, it is not without limitations. One common challenge is false signals. In volatile conditions, a candlestick may appear to be a pin bar but lacks the underlying rejection that gives the pattern its strength. This can lead to premature entries or losses if traders rely solely on the candlestick without further confirmation.
Another issue is the subjective nature of the pattern. Different charting platforms may display candlesticks slightly differently based on time zone settings or feed sources. What looks like a textbook pin bar on one trader's chart may look like a different formation on another.
Additionally, traders must consider volume and market context. A pin bar candlestick with low volume in a thin market may not carry the same significance as one formed during a high-liquidity session. Experienced traders often combine the pin bar candlestick with other indicators such as RSI or Fibonacci retracement levels to filter out weak signals.

There are multiple ways to use the pin bar candlestick in trading strategies. One of the most common is the trend continuation setup. In this approach, traders look for a pin bar candlestick that forms as a retracement during an established trend. A bullish pin bar in an uptrend may indicate the pullback is over and the upward move will resume.
Another strategy involves countertrend trading. Here, a well-formed pin bar candlestick at a key support or resistance level is used to catch potential reversals. This approach requires more caution and tighter risk control, as trading against the prevailing trend carries higher risk.
Entry methods typically involve placing a pending order just beyond the high or low of the pin bar, with a stop-loss set on the opposite end. Take profit targets may be based on nearby support and resistance levels or calculated using risk-reward ratios.
Although the pin bar candlestick is straightforward to understand, consistent results require discipline and risk management. It is not a guarantee of success, but rather a tool to enhance probability when used with a broader market framework.
The pin bar candlestick pattern remains one of the most trusted tools for identifying potential price reversals in trading. Its structure—featuring a small body and long wick—reflects market rejection and changing sentiment. From forex to commodities to equities, the pattern provides traders with a visual cue to time entries and exits more effectively.
However, like all patterns, the pin bar candlestick must be used with care. False signals, lack of confirmation, and poor market context can diminish its reliability. When applied with proper strategy, discipline, and understanding of market conditions, the pin bar candlestick can be a valuable addition to any trader's toolkit.
Disclaimer: This material is for general information purposes only and is not intended as (and should not be considered to be) financial, investment or other advice on which reliance should be placed. No opinion given in the material constitutes a recommendation by EBC or the author that any particular investment, security, transaction or investment strategy is suitable for any specific person.