Published on: 2025-05-07
The triple top pattern is a bearish reversal chart formation that signals a potential shift from an uptrend to a downtrend. Recognising and understanding this pattern can help forex traders make informed decisions and manage risk effectively.
This article will explain the triple top pattern in forex, how to trade it, compare it with other Chart Patterns, and discuss strategies.

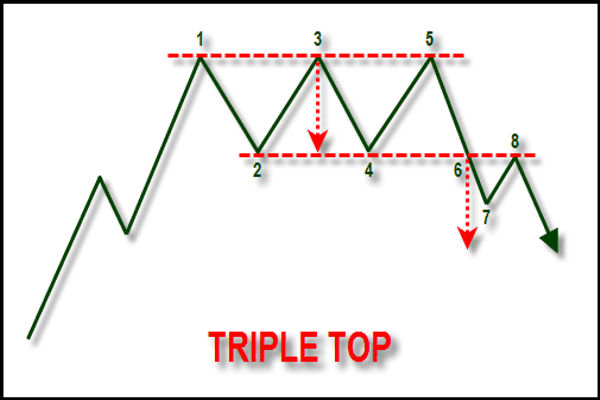
A triple top pattern forms when the price of a currency pair reaches a similar high three times, with pullbacks in between, and fails to break through a resistance level. This pattern indicates that buying pressure is weakening, and a bearish reversal may be imminent.
Key Characteristics:
Three Peaks: The price reaches a similar high three times, creating a resistance level.
Pullbacks: Between each peak, the price pulls back to a support level.
Breakout: After the third peak, the price breaks below the support level, confirming the pattern.
The triple top pattern is more reliable than the double top pattern due to the additional resistance level, reinforcing the bearish signal.
Formation and Interpretation
The formation of a triple top pattern involves the following stages:
Uptrend: The price is uptrending, making higher highs and higher lows.
First Peak: The price reaches a high and then pulls back to a support level.
Second Peak: The price rises again to the same high, forming the second peak, and pulls back to the support level.
Third Peak: The price tries for the third time to break the resistance but fails and pulls back.
Breakout: The price breaks below the support level, confirming the pattern and signalling a potential downtrend.
Volume analysis is crucial during the formation of a triple top pattern. Typically, volume decreases with each successive peak, indicating weakening buying pressure. A significant increase in volume during the breakout below the support level confirms the bearish reversal.
To trade the triple top pattern effectively, consider the following steps:
Identify the Pattern: Look for three peaks at similar price levels with pullbacks in between.
Confirm the Breakout: Wait for the price to break below the support level with increased volume.
Enter the Trade: Open a short position after the breakout is confirmed.
Set Stop-Loss: Place a stop-loss order above the highest peak to manage risk.
Set Profit Target: Measure the pattern's height (distance between the resistance and support levels) and project it downward from the breakout point to set a profit target.
Combining the triple top pattern with technical indicators like the Relative Strength Index (RSI) or Moving Average Convergence Divergence (MACD) can also enhance the reliability of the signal.
1. Confirmation of the Pattern
Identify Three Peaks: Ensure the price reaches a similar high three times, with pullbacks in between.
Volume Analysis: Look for decreasing volume with each successive peak, indicating weakening buying pressure.
Breakout Confirmation: Wait for the price to break below the support level (neckline) with increased volume to confirm the pattern.
2. Entry Point
After Breakout: Enter a short position once the price breaks below the support level, confirming the pattern.
Aggressive Entry: Some traders may enter a short position at the third peak, anticipating the reversal.
3. Stop-Loss Placement
Above Resistance: Place a stop-loss order slightly above the highest peak to manage risk.
4. Profit Target
Measure the Pattern's Height: Calculate the distance between the resistance and support levels.
Project Downward: Subtract this distance from the breakout point to set a profit target.
5. Use of Technical Indicators
Relative Strength Index (RSI): Helps identify overbought conditions, supporting the reversal signal.
Moving Average Convergence Divergence (MACD): Confirms bearish momentum when the MACD line crosses below the signal line.
Common Mistakes for Traders and How to Avoid Them
Premature Entry: Entering a trade before the breakout is confirmed can lead to false signals. Wait for a clear break below the support level with increased volume.
Ignoring Volume: Volume analysis is essential for confirming the pattern's validity. Decreasing volume during formation and increasing volume during the breakout strengthens the signal.
Neglecting Risk Management: Always set stop-loss orders to manage risk and protect against unexpected market movements.

1. Triple Top vs. Double Top
Double Top: Features two peaks at a similar price level, indicating a potential reversal.
Triple Top: Involves three peaks, providing a stronger confirmation of resistance and a more reliable reversal signal.
The additional peak in a triple top pattern suggests a more persistent resistance level, making it a more robust indicator of a bearish reversal.
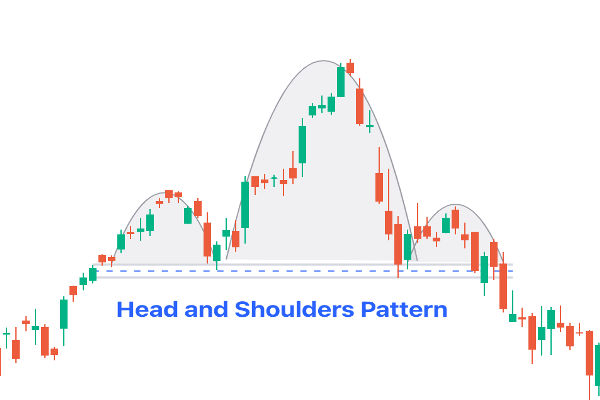
2. Triple Top vs. Head and Shoulders
Head and Shoulders: Consists of a central peak (head) flanked by two lower peaks (shoulders), signalling a reversal.
Triple Top: Comprises three peaks at approximately the same level, indicating a consistent resistance point.
While both patterns indicate a potential trend reversal, the triple top's uniform peaks suggest a strong resistance level, and the Head and Shoulders Pattern reflects a weakening trend with a distinct peak.
3. Triple Top vs. Ascending Triangle
Ascending Triangle: A continuation pattern characterised by a flat resistance line and ascending support line, indicating bullish momentum.
Triple Top: A reversal pattern with three equal peaks, signalling bearish sentiment.
The ascending triangle suggests a potential breakout to the upside, while the triple top indicates a possible downward reversal.
In conclusion, the triple top pattern is an effective tool in forex technical analysis, signalling traders about a possible bearish reversal.
By understanding its formation, confirming the breakout with volume analysis, and implementing proper risk management strategies, traders can effectively utilise this pattern in their trading decisions.
Disclaimer: This material is for general information purposes only and is not intended as (and should not be considered to be) financial, investment or other advice on which reliance should be placed. No opinion given in the material constitutes a recommendation by EBC or the author that any particular investment, security, transaction or investment strategy is suitable for any specific person.