Published on: 2025-07-04
Updated on: 2025-07-04
In the complex and ever-evolving world of financial trading, indicators serve as indispensable tools for identifying market behaviour and optimising entry and exit points. One such tool, both visually intuitive and rooted in solid market psychology, is the Williams Alligator indicator. Designed by renowned trader and psychologist Bill Williams, this indicator helps traders determine whether a market is trending or consolidating, allowing them to capitalise on meaningful price movements.
In this article, we'll explore the foundational concepts of the Williams Alligator, delve into its structural components, and examine the psychological metaphor that gives the indicator its name.
 The Williams Alligator is a technical analysis tool developed by Bill Williams as part of his wider trading system based on behavioural finance. Its primary objective is to highlight the presence and direction of a trend—whether the market is "awake" and trending or "asleep" and consolidating.
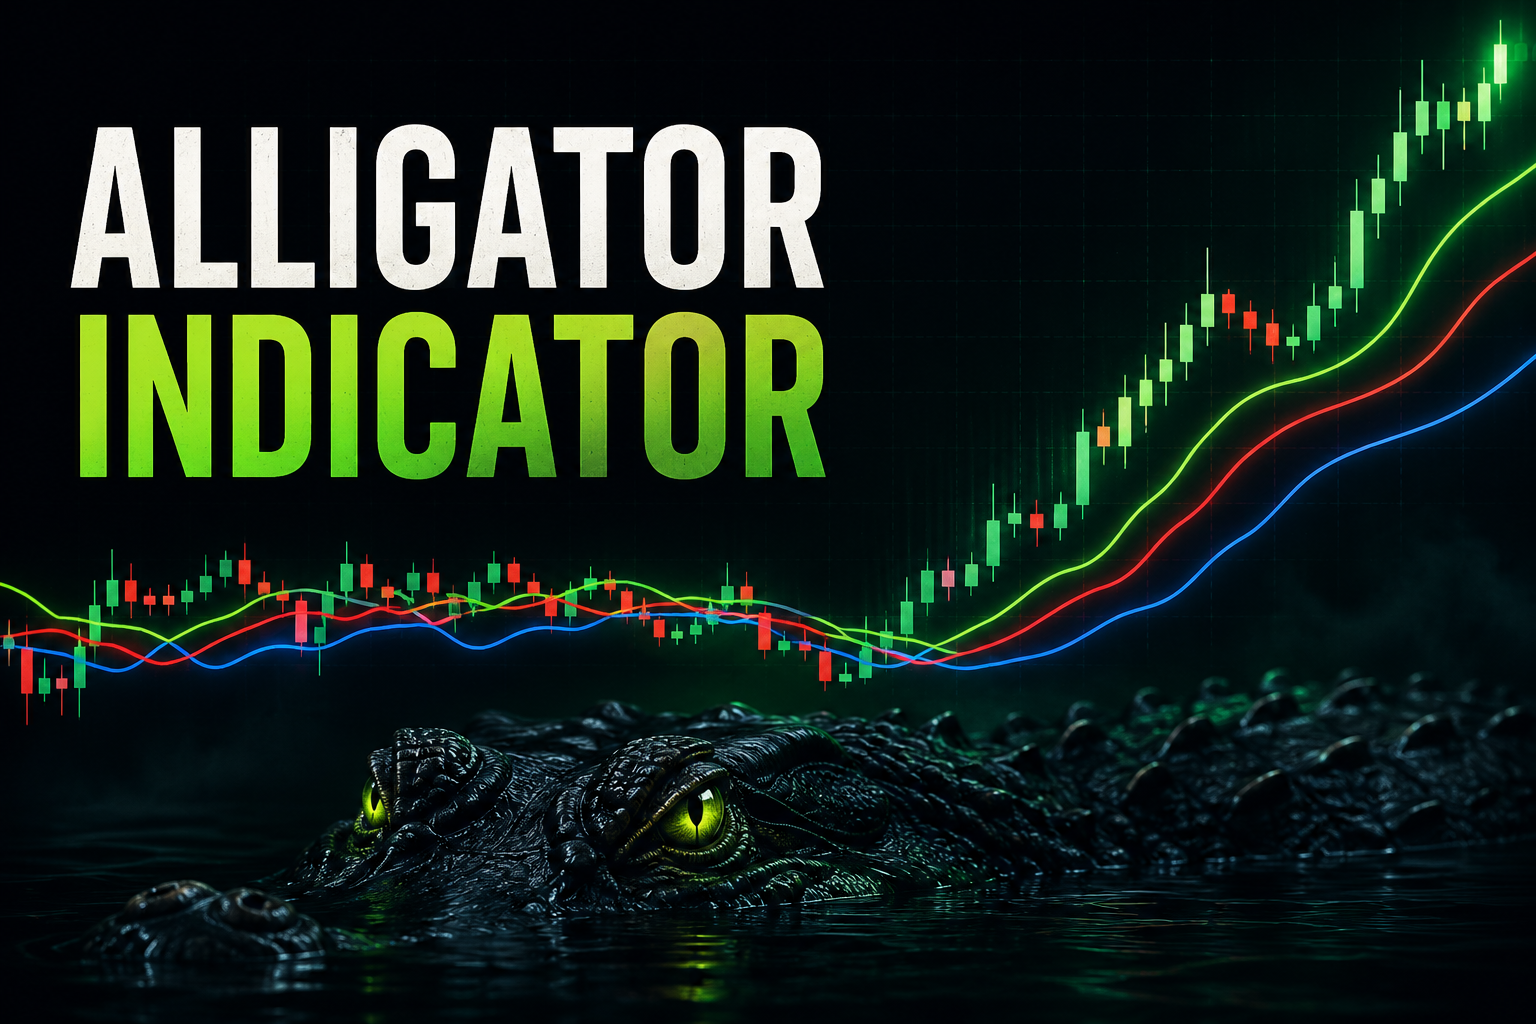
Rather than relying on a single moving average, the Williams Alligator employs three smoothed moving averages, each offset into the future. The design of the indicator enables it to visually resemble the jaw, teeth, and lips of an alligator, which inspired its name. These three lines interact in such a way that traders can observe phases of market "hunger" or "slumber," serving as a metaphor for when the market is actively trending or lying dormant.
The Williams Alligator stands out in that it does not try to predict market behaviour but instead responds to it, helping traders align with the existing momentum rather than prematurely anticipating reversals.
 The Alligator is made up of three smoothed moving averages, each representing a different part of the metaphorical creature:
Jaw (Blue Line):
This is the slowest of the three lines and represents the "sleeping" phase of the alligator. Technically, it is a 13-period Smoothed Moving Average (SMMA), shifted 8 bars into the future.
Teeth (Red Line):
This is a medium-speed SMMA that reacts more quickly than the Jaw but less rapidly than the Lips. It is an 8-period SMMA, shifted 5 bars forward.
Lips (Green Line):
The fastest line, representing the most responsive part of the market, is the Lips. It is a 5-period SMMA, shifted 3 bars forward.
All three lines are calculated using the median price (i.e. (High + Low) / 2) rather than the closing price, which is often used in other indicators. The forward shifting of the lines creates a distinctive overlapping visual that helps determine whether the market is preparing to "feed" (trend) or rest (range).
The Williams Alligator is typically colour-coded for ease of reading on trading platforms:
Jaw (Blue) – slow and steady, this line is often at the bottom in an uptrend and at the top in a downtrend.
Teeth (Red) – situated between the Jaw and Lips, serving as a bridge.
Lips (Green) – quickest to react, and the first to indicate potential changes in momentum.
When these lines converge and intertwine, it suggests that the alligator is "sleeping"—the market is in a range or moving sideways. This phase is best avoided by trend-following traders, as there is little directional conviction.
Conversely, when the lines separate and fan out, the alligator has "woken up" and is beginning to "feed." This is a strong signal that a trend is developing. The greater the distance between the lines, the stronger the trend is considered to be.
By observing the direction and separation of these three lines, traders can visually grasp the state of the market with minimal reliance on complex mathematical interpretation.
At the core of the Williams Alligator is the Smoothed Moving Average (SMMA)—a variation of the standard moving average that reduces noise and provides a clearer view of the prevailing trend.
The general formula for an SMMA is as follows:
SMMA(i) = (SMMA(i-1) × (N - 1) + Price(i)) / N
Where:
SMMA(i) is the current smoothed value,
SMMA(i-1) is the previous smoothed value,
Price(i) is the current median price,
N is the smoothing period.
Each line—Jaw, Teeth, and Lips—is calculated using this formula, with the key difference being the length of the period and the number of bars shifted into the future.
The forward displacement of each line is not an arbitrary design choice. It reflects Bill Williams' theory that market signals lag behind market psychology, and that forward-projected averages help traders to act slightly ahead of the price action based on the "awakening" of the alligator.
The most memorable feature of this indicator is undoubtedly its metaphor. Bill Williams likened the market to an alligator with distinct behavioural patterns:
When the Jaw, Teeth, and Lips are intertwined, the alligator is sleeping. The market is consolidating, and traders should stay out to avoid false breakouts.
When the lines diverge and move in tandem, the alligator has awoken and begins to "eat"—this represents the emergence of a strong trend.
Once the alligator has "fed" enough, it begins to lose interest, and the lines converge once more. This is a warning sign that the trend may be ending or taking a pause.
This metaphor does more than just add personality—it underscores the cyclical nature of markets. Trends develop, mature, and dissipate, much like the natural rhythm of a predator's sleep and hunting cycle. For traders, it provides an accessible way to conceptualise complex market dynamics.
The Williams Alligator is a deceptively simple yet highly effective indicator that brings clarity to the often-chaotic world of trading. Through its three-line system and vivid metaphor, it enables traders to visually interpret trend strength, direction, and potential reversals.
By understanding how the Jaw, Teeth, and Lips interact, traders can stay on the right side of the market and avoid unproductive trading during consolidations. While not infallible—and best used alongside complementary tools like volume, RSI, or Fractals—the Alligator remains a popular and respected component of many traders' toolkits.
Whether you're a novice seeking an intuitive entry into technical analysis or an experienced trader looking to reinforce trend-following strategies, the Williams Alligator offers a uniquely psychological and visual approach to reading market behaviour.
Disclaimer: This material is for general information purposes only and is not intended as (and should not be considered to be) financial, investment or other advice on which reliance should be placed. No opinion given in the material constitutes a recommendation by EBC or the author that any particular investment, security, transaction or investment strategy is suitable for any specific person.