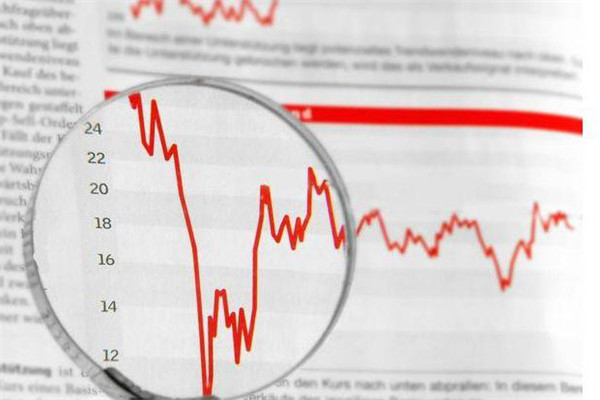
Relative Strength of RSIIndex is a technical analysis indicator used to measure the intensity and speed of price fluctuations. This indicator determines the overbought or oversold situation of an asset by comparing its average rise and fall over a period of time.

The calculation of RSI indicators is based on two important parameters: period length and overbought/oversold level. Normally, the duration of the rsi indicator is 14 days, with an overbought level of 70 and an oversold level of 30.
When calculating RSI indicators, it is first necessary to calculate the daily closing price fluctuation range, and then accumulate the increase and decrease separately, and divide them by a specific time period (such as 14 days) to obtain the average increase and decrease. Next, bring these two averages into the following formula:
RSI=100- (100/(1+RS))
Among them, RS represents the ratio of the average increase divided by the average decrease.
Based on the RSI indicator values, it is possible to determine the overbought or oversold situation of assets. When the RSI index exceeds 70, it indicates that the asset is in an overbought state, and the market may engage in selling behavior, leading to a price drop; When the RSI indicator is below 30, it indicates that the asset is in an oversold state, and the market may engage in buying behavior, leading to price increases.
Advantages and Disadvantages of Relative Strength Indicators (RSI)
RSI relative strength indicators have the following advantages:
It can help traders identify overbought and oversold signals in the market, thereby determining the timing of buying or selling.
The RSI indicator is a relative indicator that can eliminate the impact of noise in the market and more accurately reflect market trends.
RSI indicators can be applied to various types of financial assets, including stocks, foreign exchange, commodities, futures, etc.
RSI indicators can also be used to analyze market trends and intensity, helping traders develop long-term trading strategies.
RSI relative strength indicators also have some drawbacks, as follows:
The RSI indicator is a follower indicator that needs to wait for price changes before calculating the corresponding value, which may cause traders to miss some buying or selling opportunities.
RSI indicators may be influenced by market noise, leading to false overbought or oversold signals, which can mislead traders' decisions.
RSI indicators are not applicable to all markets, and some markets may exhibit different behavioral patterns, resulting in RSI indicators losing their predictive power.
【 EBC Platform Risk Reminder and Disclaimer 】: There are risks in the market, and investment needs to be cautious. This article does not constitute investment advice.


