The term spread (the difference between long-term and short-term interest rates) is an astonishingly accurate indicator for predicting future economic activity.
In the past 60 years, negative term spreads, namely the reverse Yield curve, have appeared before every economic recession in the United States. In addition, there will always be an economic slowdown after a negative term spread, and in addition to one, there will also be an economic recession.
The current environment is somewhat unique - low interest rates and risk premiums - and the term spread for predicting economic slowdown does not seem to be affected.
One of the most common relationships in macroeconomics is the relationship between term spread (the difference between long-term and short-term interest rates) and future economic activity. The negative term spread, that is, the reverse Yield curve, reliably predicts the growth of low output in the future and indicates the high probability of recession.
This relationship applies not only to the United States, but also to some other developed economies. Among a wide range of economic and financial indicators, interest rate spread is one of the most reliable indicators for predicting future economic activity, and therefore has received close attention from professional forecasters and policy makers.
Is the reverse Yield curve an indicator of economic recession or a self fulfilling prediction?
In other words, does the reverse Yield curve predict recession or lead to recession? This seems to be a simple question, the answer is obvious, but there may be more questions to explain.
The problem is simple, because even if you don't know what the reverse Yield curve is, you should be able to distinguish between prediction and causality. If you know what the reverse Yield curve is, you will think that the answer is obviously "prediction".
After all, how can indicators such as the reverse Yield curve have a causal relationship? Of course, the environment leading to the reverse Yield curve is the real reason for the recession, not the indicator itself, right?
But here, we want to propose the opposite viewpoint.
At least in some cases, the reverse Yield curve will actually lead to economic recession. This is mainly because the reverse Yield curve is not only a signal that the central bank policy does not match the market's expectations of future conditions, but also can actually be used by the financial market to pressure the central bank policy.
A simple fact is that everyone hears' a very accurate recession indicator, only one false positive indicator turned red last week '. It's best to fasten your seat belt, as we will face an economic recession in 6 to 24 months
What is the Yield curve?
The US Treasury finances the federal government's budget obligations by issuing various forms of debt. The US $23 trillion treasury bond bond market includes treasury bonds with maturities from one month to one year, from two years to 10 years, and 20- and 30-year treasury bonds.
The Yield curve depicts the yield of all Treasury bills.
Usually, this curve tilts upwards because investors expect that if they bear the risk that rising inflation will lower the expected return on holding longer-term bonds, they will receive more compensation. This means that the yield of 10-year treasury bond is usually higher than that of two-year treasury bond, because its duration is longer. The yield and price trends are opposite.
The important point to note is that generally the Yield curve (all yield curves over time) is upward sloping, because investors want more compensation for 10-year loans than for two-year loans. This is not only to compensate for inflation and default risks, but also to compensate for the common fact that currency is more valuable now than in the future.
I would rather have $100 now than $102 a year later. I would rather receive $102 in one year than $104 in two years.
What does the reverse Yield curve mean?
On some maturity dates, the reverse Yield curve does not slope upward, but downward. For example, this means that the 10-year interest rate is lower than the two-year interest rate.
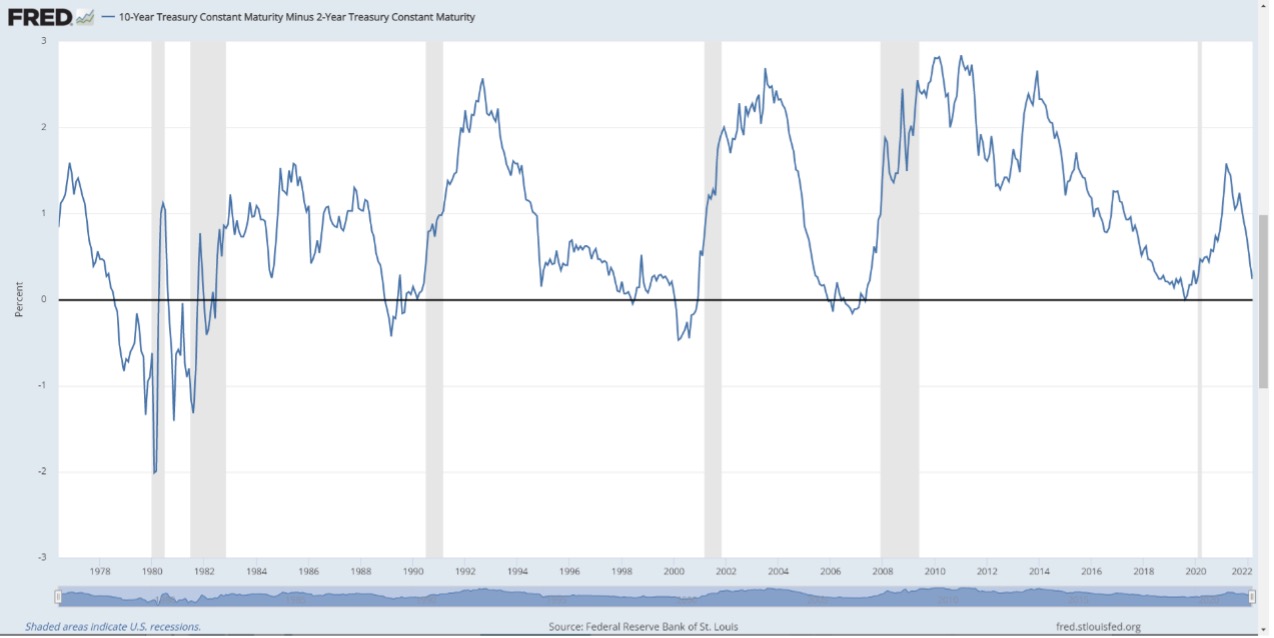
According to the Federal Reserve Bank of San FranciscoA report from 2018 found that since 1955, the economic curve of the United States has been reversed before each recession, with a recession occurring 6 to 24 months later. During that period, it only sent out the wrong signal once.
The last reversal of the Yield curve was in 2019. The following year, the United States entered an economic recession - despite being caused by the global pandemic.
The reverse Yield curve can be regarded as a hedge. The market believes that there may be an economic recession, so they allocate funds to longer-term returns. However, things are rarely so simple. This is not just because the market believes there may be a recession. On the contrary, the reverse Yield curve actually means that the market believes that the central bank "lags behind the curve".
This means that the market's expectations of future conditions are significantly different from the central bank's estimates. But this is not a simple static situation; It is a dynamic two-way channel between Wall Street and the Federal Reserve.
The meaning here is that financial markets can force central banks to take certain actions. If the tightening force of the central bank exceeds market expectations, then in an isolated system, the short-term market decline may exceed the "rational" level, but to some extent, this will lead to the central bank relaxing tightening conditions.
A prophet or self-fulfilling prophecy
Therefore, we believe that the reverse Yield curve is a self fulfilling prediction that the market can use as a negotiation strategy with the central bank. It is self fulfilling because it is very successful in predicting decline. This is a common trend in technical analysis, where an indicator can become so successful that it actually leads to price fluctuations.
But it is self actualizing in a deeper way, as it is a "tool" that financial markets can use to exert pressure on central bank policies. If a reverse Yield curve appears on the horizon, the market can use it to claim that the central bank has clearly not correctly interpreted the situation.
In a sense, this is a win-win situation for the central bank. The central bank always seems wrong. Tighten when you should relax, and vice versa. But part of the reason is not that the central bank always makes mistakes, but that the market is trying to manipulate central bank policies in a way that maximizes cross period profits.


