Published on: 2023-06-05
Updated on: 2024-06-21
The first thing you should understand is that the Fibonacci tool works best when the market is in a trend.
When the market is in an upward trend, it is usually wise to choose to long or buy before the exchange rate retreats to the Fibonacci support level. When the market is in a downward trend, it is best to choose to short or sell when the exchange rate retreats to the Fibonacci resistance level.
In order to find these retracement positions, you must first find the nearest band high and band low. Then, for a downward trend, select the Fibonacci drawing tool, click on the recent band high point with the mouse, and drag the mouse to the nearest band low point.
For an upward trend, the drawing process is opposite to the downward trend.
Do you understand? Now, let's take a look at some specific examples of how to utilize Fibonacci's pullback in the market.
Upward trend
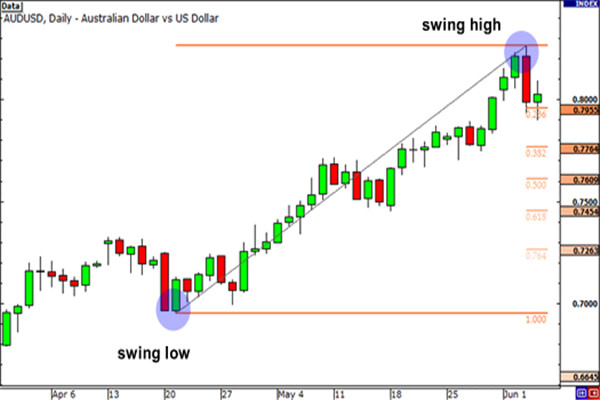
The following chart shows the daily chart of AUD/USD:

Firstly, click on the low point of band 0.6955 on April 20th with the mouse, and drag to the high point of band 0.8264 on June 3rd. The software will automatically display the Fibonacci retracement level you have drawn.
As shown in the above figure, the Fibonacci retreat positions are: 0.7955 (23.6%), 0.7764 (38.2%), 0.7609 (50.0%), 0.7454 (61.8%), and 0.7263 (76.4%).
Now, the market expectation is that if the AUD/USD retreats from its recent high, the exchange rate will gain support at a certain Fibonacci retreat level, as traders will place buying orders near these levels as the exchange rate falls.
Now, let's take a look at the trend after the exchange rate reaches the peak of the band:

After falling below the Fibonacci retracement level of 23.6%, the AUD/USD retracement will continue to decline in the coming weeks. The exchange rate even tested a 38.2% retracement level, but ultimately found it difficult to close below that line.
Then, around July 14th, the market resumed an upward trend and ultimately broke through the previous band high. It is evident that buying at a 38.2% retracement level has benefited significantly in long-term trading.
Downward trend
Now, let's take a look at how to use the Fibonacci pullback tool in a downward trend.
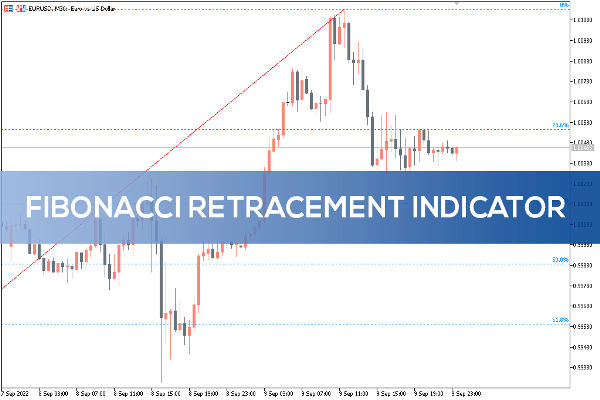
The following figure shows a 4-hour chart of Euro/USD:

The high point of the band was seen at 1.4195 on January 26, and the low point of the band was seen at a daily low of 1.3854 set on February 2 a few days later. The Fibonacci retracement levels were 1.3933 (23.6%), 1.3983 (38.2%), 1.4023 (50.0%), 1.4064 (61.8%), and 1.4114 (76.4%).The market's expectation for a downward trend is that if the exchange rate retreats from the low point of the 1.3854 band, it will encounter resistance at a certain Fibonacci level, as traders will set sell orders at the above price level.
Let's see what happens next?

Is the euro/dollar trend very perfect?
The exchange rate first attempted to rebound, and after briefly encountering obstacles at the 38.2% Fibonacci retracement level, further rebounded to test the 50% retracement level. If you set some sell orders at a Fibonacci retracement level of 38.2% or 50%, you will profit from this.
From the above two examples, we can see that the exchange rate has gained temporary support or resistance at the Fibonacci retracement level. Because almost everyone is using Fibonacci tools, these levels will become resistance and support levels for self actualization.
However, one thing you must remember is that prices do not always rebound from these levels. You must be alert to some possible 'dead zones' that may arise.
Now, you should always remember that the use of Fibonacci tools is not always that simple. If their application is so simple, traders will always keep their orders at the Fibonacci level, and the market will always continue to trend.
EBC Platform Risk Reminder and Disclaimer: There are risks in the market, and investment needs to be cautious. This article does not constitute investment advice.


World's Best Broker