Diterbitkan pada: 2023-08-09
Head and Shoulder Top adalah pola grafis yang digunakan dalam analisis teknis untuk memprediksi pembalikan trends dalam saham, pertukaran asing, dan pasar keuangan lainnya. Namanya mengikuti bentuknya yang mirip kepala dan bahu seseorang, terdiri dari tiga puncak dan dua lembah. Patung kepala ke bahu biasanya muncul di atas trend naik, menunjukkan bahwa harga akan menurun.

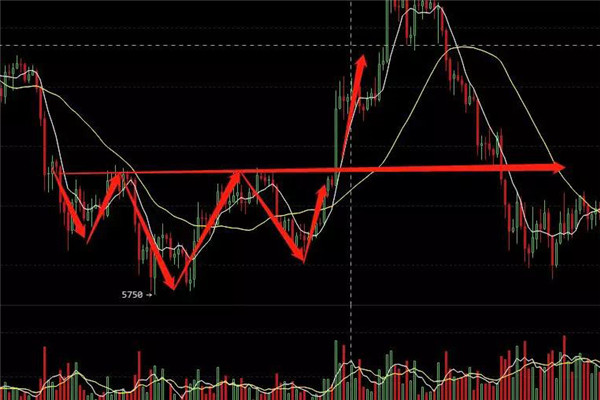
Formasi pola kepala-bahu-atas memerlukan tiga tahap. Pertama, di tahap bahu kiri, harga naik ke puncak dan kemudian jatuh kembali, membentuk trough pertama. Tahap berikutnya adalah tahap kepala, di mana harga naik lagi ke puncak yang lebih tinggi dan kemudian jatuh kembali lagi, membentuk trough kedua, yang biasanya lebih rendah dari trough di bahu kiri. Akhirnya, di tahap bahu kanan, harga naik lagi tetapi tidak mencapai titik tinggi di kepala, dan kemudian jatuh lagi, membentuk trough ketiga, yang biasanya mirip dengan trough di bahu kiri.
The important feature of the head-shoulder top pattern is the neck line, which is a horizontal line connecting the left shoulder and the low valley of the head. When the price falls below the neckline, it is seen as an important selling signal, indicating that the price will further decline. Investors usually use the neck line of the head-to-shoulder pattern as a signal line to trigger selling or short selling.
The effectiveness of the head-shoulder-top mode depends on the integrity of its form and the confirmation of trading volume. The integrity of the pattern means that the high and low points of each stage are clearly visible and meet the shape requirements of the pattern. The confirmation of trading volume means that during the formation of the head-to-shoulder pattern, trading volume should exhibit a certain pattern, such as relatively low trading volume in the head stage.
Although the head shoulder top model is widely used in technical analysis, not all head shoulder top models can successfully predict price declines. Therefore, when using the head-shoulder-top model for trading decisions, investors should conduct comprehensive analysis based on other technical indicators and market trends to improve the accuracy and success rate of transactions.
The effectiveness of the head-shoulder-top mode lies in the breakthrough of the neck line. When the price drops below the neckline level, the pattern is confirmed, and investors usually adopt a selling strategy, expecting the price to continue to decline. The downward break of the neckline is considered an important selling signal, which can trigger more selling orders and accelerate the downward trend.
The emergence of the head-to-shoulder top model is often seen as a shift in market sentiment from buying to selling. It reflects the trend of gradually weakening long positions and increasing short positions in the market. The formation of the head-shoulder top pattern takes a certain amount of time, usually a few months, and is therefore considered a long-term trend reversal pattern.
The predictive ability of the head-shoulder-top model depends to a certain extent on the liquidity of the market and the behavior of participants. In situations with high liquidity and a large number of market participants, the head-to-shoulder top model may have stronger predictive power. However, in situations of low liquidity and fewer market participants, the effectiveness of the head-to-shoulder model may decrease.
The head-shoulder top mode is not absolutely accurate; sometimes prices may rebound before breaking through the neckline, or the downward movement of the neckline may be temporary. Investors should be cautious when using the head-to-shoulder top model and conduct comprehensive analysis in conjunction with other technical indicators and market trends to make more accurate decisions.
Penolakan: investasi melibatkan risiko. isi artikel ini bukanlah saran investasi dan tidak merupakan tawaran atau permintaan untuk menawarkan atau merekomendasikan produk investasi apapun.


BROKER TERBAIK
DUNIA
World's Best Broker