How to conduct trading volume prices difference analysis ?
2023-06-01 Summary:
Trading volume refers to the trading volume completed by an exchange within a certain period of time, usually represented by a bar chart; price refers to the transaction price of the exchange at the same time, usually represented by a line chart or a K line chart.
Trading volume price difference analysis is a technical analysis method that uses observations of trading volume and price changes in the market to determine market trends and forces. Trading volume refers to the trading volume completed by an exchange within a certain period of time, usually represented by a bar chart; price refers to the transaction price of the exchange at the same time, usually represented by a line chart or a K line chart.

The analysis of trading volume price differences mainly includes the following aspects:
1. Changes in trading volume: Trading volume is an important indicator that reflects the trading sentiment and behavior of market participants. When trading volume increases, it usually means that the emotions of market participants are changing, and it is necessary to pay attention to the market trend.
2. Price changes: Price reflects the relationship between market supply and demand, and the rise and fall of price reflect the trend and strength of the market. The market trend can be judged based on the rise and fall of prices.
3. Compare changes in trading volume and price: Changes in trading volume and price are usually interrelated. When the price rises and the trading volume increases, it indicates that the market's bulls are strong; when the price drops and the trading volume increases, it indicates that the market's bears have strong strength. In addition, the strength of the market can also be observed by calculating the difference between trading volume and price.
Trading volume and price difference analysis is a method of predicting market trends by observing changes in trading volume and prices. Here are some basic methods for analyzing trading volume and price differences:
Firstly, observe the changes in trading volume and prices. If the price rises and the trading volume also increases, it indicates that the market has strong bullish forces and can be considered for buying. On the contrary, if the price drops and the trading volume increases, it indicates that the market has strong short-selling power and can be considered for sale.
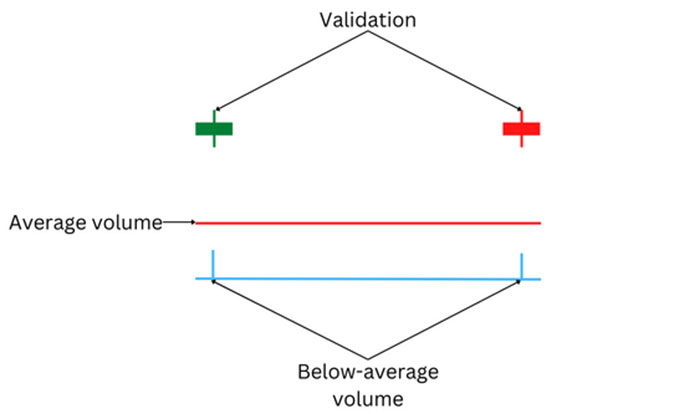
Secondly, the current level of market activity can be determined by comparing current trading volume with historical average trading volume. If the current trading volume is much higher than the historical average trading volume, it indicates that the market is very active and there may be important market events or news that need to be handled with caution. On the contrary, if the current trading volume is lower than the historical average trading volume, it indicates that the market is relatively calm and some more conservative trading strategies can be considered.
Finally, the strength of the market can be observed by calculating the difference between trading volume and price. If the trading volume increases but the price does not rise with it, then market forces may be shifting and close attention needs to be paid. On the contrary, if the trading volume increases and the price is also rising, it indicates that the market has strong bullish forces and can be considered for buying.
In short, the analysis of trading volume price differences requires a combination of multiple factors to make judgments, requires caution, and requires continuous learning and practice.

Microsoft's growth path and investment value
Microsoft's tech leadership, diverse ventures, and stable dividends offer strong investment potential and long-term growth prospects.
2024-05-17
A Guide to Calculating and Applying Sharpe Ratio
The Sharpe ratio gauges risk-adjusted returns, aiding in the selection of strong investments based on higher returns per unit of risk.
2024-05-17
Non-ferrous metal overview and investment analysis
Non-ferrous metals perform well in economic expansion but can be volatile due to sentiment. Investors should monitor supply-demand and global trends.
2024-05-17


